今回は、私が作成したプログラムを後輩に与えた時、後輩のパソコンではマウスコントロールを使って画像を切り替えることができなかったときの事を書きます。
まさか、そんなことはないでしょ~。
後輩から
「先輩、マウスホイールを回しても画像が切り替わらないんです」
なんて言われて、
「何を言っているの。俺のパソコンではきちんと動いているよ。」
コードは、メールにて送っており、どこも変更していないとのこと。
「だったら、エラーコードは?」
「エラーも出ていません」
なんで~~。その時は、学会も近かったのでとりあえず、複数の画像を読み込まないように変更をかけて何とか凌ぎました。
学会終了後は、そのまま時が過ぎて何事もなかったかのように時が過ぎていきました。
あれ?ほんとだ動かない
で、最近新しいプログラムを作成し自分のパソコンから職場のパソコンに移植しました。
あれ??マウスホイールを回しても画像が変わらない。

matplotlibの拡大縮小のボタンをクリックしてからマウスホイールを回して、クリックすると画像が切り替わる。なんで~~~。
とりあえず、動くは動くけど遅いし手間がかかる~~~。
原因が判明!!
原因は、matplotlibのバックエンドなるもの。
確認方法は以下の一文をコードを書き込みバックエンドを確認
print(matplotlib.get_backend())
今回は、動かないPCでは ”QtAgg” でした。
なので、
import文を記載しているところに
matplotlib.use(‘TkAgg’)
と記載することで解決しました。
対応策としては、matplotlibの設定ファイルを変更することでも対応できるらしいのですが、
やはり明示的に記載しておく方が間違いないかなと思います。
なお、詳細は以下のサイトにありますので、興味ある方はご覧になってください。
The post えっ?なんで?matplotlibでマウスコントロールが使えない。。。 first appeared on 診療放射線技師がPythonをはじめました。.]]>matplotlibを使ってカラー表示をする際、既存のカラーマップでは満足がいかないことがあると思います。
そんな時は自作でカラーマップを作ってしまおうというのが今回の企画です。
準備
カラーマップ表示するには、どの値からどの値までを、どの様な区切りで表示するか考えます。
その後、その区切りをどの色で表示するか決めます。
今回は0~99までの値を10区切りで、色を
[ black , lightgrey , darkorange , gole , chartreuse , palegreen , mediumspringgreen , paleturquoise , steelblue , navy ]
上記10色で表示してみたいと思います。
matplotlibのカラー表示はここで確認できます。
seaborn
今回はseabornのヒートマップを用いて確認をしてみます。
ちなみに、seabornはデータの可視化をmatplotlibよりも強力にサポートしてくれるライブラリーです。
今回提示するヒートマップもseabornならではの機能です。
seabornはmatplotlibと違うライブラリーかと思われるかもしれませんが、実は内部ではmatplotlibが動いているらしいです。
もちろん、カラーマップの設定はmatplotlibでも利用できますのでご安心を。
等間隔で色を付けたい場合
色を指定します。先ほども提示しましたが再度掲示します。
cmap = ListedColormap(
    [ 'black' , 'lightgrey' , 'darkorange' , 'gold' , 'chartreuse' ,
      'palegreen' , 'mediumspringgreen' , 'paleturquoise' , 'steelblue' , 'navy' ])
ここで注意していただきたいので色の名前はシングルコーテーション「 ‘ 」で囲う必要があります。
それでは、コードを提示します。
import numpy as np
import matplotlib.pyplot as plt
from matplotlib.colors import ListedColormap, BoundaryNorm
import seaborn as sns

arr = np.arange(100)
arr = arr.reshape([10,10])
print(arr)

fig=plt.figure(figsize=(5, 5))
ax1 = fig.add_subplot(1,1,1)
ax1.axes.xaxis.set_visible(False), ax1.axes.yaxis.set_visible(False)
ax1.spines['bottom'].set_visible(False), ax1.spines['top'].set_visible(False)
ax1.spines['right'].set_visible(False), ax1.spines['left'].set_visible(False)


cmap = ListedColormap(
    [ 'black' , 'lightgrey' , 'darkorange' , 'gold' , 'chartreuse' ,
      'palegreen' , 'mediumspringgreen' , 'paleturquoise' , 'steelblue' , 'navy' ])


norm = BoundaryNorm(bounds, cmap.N)

ax1 = sns.heatmap(arr, annot=True, cbar=True, cmap=cmap)


plt.show()
きちんと10間隔で設定した色通りに表示されています。
等間隔で色を変えたい場合はこれでいいのですが、例えば40~60の間だけ色を変えたい場合はこれではうまくいきません。
等間隔ではなく、特定の区間だけ色を変えたい場合
ある領域だけ色を変えたい場合はまず色分けする領域を指定する必要があります。
30~70の間だけを5づつ色を付けたい場合、まず色の指定範囲を以下のように設定します。
bounds = [0, 30, 35, 40, 45, 50, 55, 60, 65, 70, 100]ただ、これだけだと範囲と色の組み合わせができていません。
なので「BoundaryNorm」という関数を使って紐づけしてあげます。
norm = BoundaryNorm(bounds, cmap.N)ちなみに、cmapの後の「 .N 」とはboundsとcmapに対応させる意味があるらしいです。これが無いとエラーになります。
そして、これを画像設定axの中に組み込んでいきます。
ax1 = sns.heatmap(arr, annot=True, cbar=True, cmap=cmap, norm=norm)コード全体としては
import numpy as np
import matplotlib.pyplot as plt
from matplotlib.colors import ListedColormap, BoundaryNorm
import seaborn as sns

arr = np.arange(100)
arr = arr.reshape([10,10])
print(arr)

fig=plt.figure(figsize=(5, 5))
ax1 = fig.add_subplot(1,1,1)
ax1.axes.xaxis.set_visible(False), ax1.axes.yaxis.set_visible(False)
ax1.spines['bottom'].set_visible(False), ax1.spines['top'].set_visible(False)
ax1.spines['right'].set_visible(False), ax1.spines['left'].set_visible(False)


cmap = ListedColormap(
    [ 'black' , 'lightgrey' , 'darkorange' , 'gold' , 'chartreuse' ,
      'palegreen' , 'mediumspringgreen' , 'paleturquoise' , 'steelblue' , 'navy' ])


bounds = [0, 30, 35, 40, 45, 50, 55, 60, 65, 70, 100]

norm = BoundaryNorm(bounds, cmap.N)


ax1 = sns.heatmap(arr, annot=True, cbar=True, cmap=cmap, norm=norm)


plt.show()
matplotlibではどうする?
ax1 = sns.heatmap(arr, annot=True, cbar=True, cmap=cmap, norm=norm)
の部分を以下に変更すれば完了です。
ax1.imshow(arr, cmap=cmap, norm=norm)
なお、matplotlibで値を表示する機能は標準ではないと思われますので、もし値を表示したい方はseabornを用いた方が簡便でいいかと思われます。
お疲れ様でした。
はじめに
前回、領域抽出の記事を書きましたが初めにやる処理、閾値設定がうまくいかないと抽出結果が思い通りにいかない結果となってしまいます。
ということで、今回はその閾値設定を可視化できるプログラムを組んでみたという記事です。
前回はjpg画像を使用しましたが、今回はDICOM画像を用いて行ってみたいと思います。
プログラムの流れ
今回の最終形はスライダーを用いて閾値設定をし視覚的に確認する事を目標にします。その為、元の画像と、閾値設定をした画像の2画像を表示し、片方の画像に閾値設定を適応することにします。どうせですので、閾値設定じゃない方の画像のWW,WLを調整できるようにスライダーを設定します。
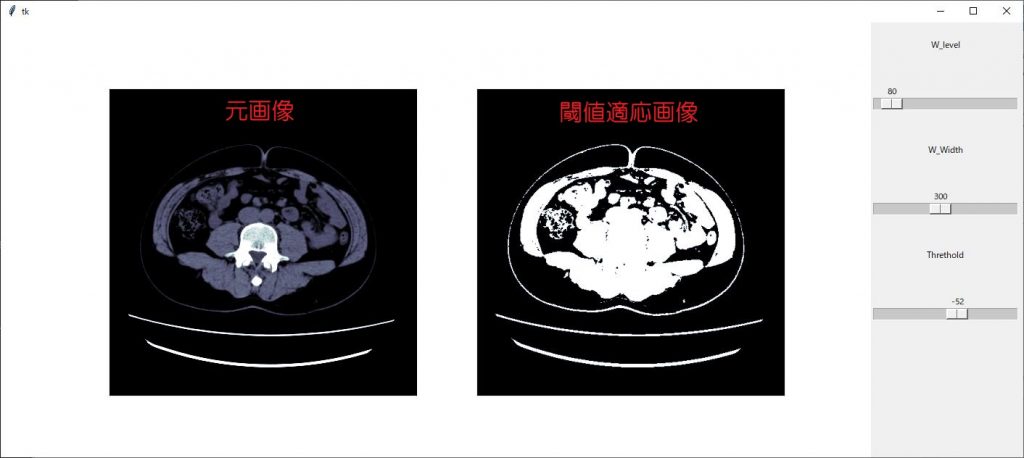
それでは、流れです
- DICOM画像を読み込み
- matplotlibの設定
- tkinterの設定(領域設定と、スライダー設定)
- スライダー変更時の動作設定
- 仕上げ
DICOM画像を読み込み
DICOM画像の読み込みですが、以前作成したモジュールを使用します。今回は1枚だけ読み込みをします。
import pydicom
import numpy as np
import fileselect as fs

def main():

    filename = fs.single_fileselect()
    dcm = pydicom.dcmread(filename)
    img_arr = dcm.pixel_array
    w_level = int(dcm[0x0028, 0x1050].value)
    w_width = int(dcm[0x0028, 0x1051].value)

if __name__ == "__main__":
    main()
画像を表示した際、適正条件で表示するためにウインドウレベルとウインドウ幅の情報もDICOMタグから取り込んでおきます。
matplotlibの設定
matplotlibの設定をします。設定項目は画像全てを表示する領域サイズの指定
画像領域の設定、軸の表示設定をします。
まずは、画像全てを表示する領域サイズの指定です。
fig = plt.figure(figsize=(12, 6))
表示領域は横12インチ、縦6インチとしました。
続いて、画像表示数はオリジナル画像と、閾値設定した画像の2枚を表示しますので2つ設定します。
ax1 = fig.add_subplot(1, 2, 1)
ax2 = fig.add_subplot(1, 2, 2)
そして、それぞれの画像に軸の表示はいらないので
ax1.axes.xaxis.set_visible(False), ax1.axes.yaxis.set_visible(False)
ax2.axes.xaxis.set_visible(False), ax2.axes.yaxis.set_visible(False)
で軸の表示を無くしておきます。
まずは、matplotlibをインポートしてからコードを足していきましょう。
import pydicom
import fileselect as fs
import matplotlib.pyplot as plt

def main():

    filename = fs.single_fileselect()
    dcm = pydicom.dcmread(filename)
    img_arr = dcm.pixel_array
    w_level = int(dcm[0x0028, 0x1050].value)
    w_width = int(dcm[0x0028, 0x1051].value)

    fig = plt.figure(figsize=(12, 6))
    ax1 = fig.add_subplot(1, 2, 1)
    ax2 = fig.add_subplot(1, 2, 2)

    ax1.axes.xaxis.set_visible(False), ax1.axes.yaxis.set_visible(False)
    ax2.axes.xaxis.set_visible(False), ax2.axes.yaxis.set_visible(False)

if __name__ == "__main__":
    main()
tkinterの設定(領域設定と、スライダー設定)
tkinterの領域設定は、先ほど設定したmatplotlibの領域と、この後設定するスライダーを合わせた領域を設定していきます。
root = tk.Tk()
root.geometry(“1410×600”)
まずは、tk.TK()で領域を作成します。その後、geometryで領域のサイズを指定しています。
Canvas = FigureCanvasTkAgg(fig, master=root)
Canvas.get_tk_widget().grid(row=0, column=0, rowspan=10)
FigureCanvasTkAgg(fig, master=root)でtkinter上にmatplotlibの画像の表示設定します。
ライブラリーのインポートを忘れないでくださいね。
from matplotlib.backends.backend_tkagg import FigureCanvasTkAgg
import pydicom
import numpy as np
import fileselect as fs
import matplotlib.pyplot as plt
from matplotlib.backends.backend_tkagg import FigureCanvasTkAgg

def main():

    filename = fs.single_fileselect()
    dcm = pydicom.dcmread(filename)
    img_arr = dcm.pixel_array
    w_level = int(dcm[0x0028, 0x1050].value)
    w_width = int(dcm[0x0028, 0x1051].value)

    fig = plt.figure(figsize=(12, 6))
    ax1 = fig.add_subplot(1, 2, 1)
    ax2 = fig.add_subplot(1, 2, 2)

    ax1.axes.xaxis.set_visible(False), ax1.axes.yaxis.set_visible(False)
    ax2.axes.xaxis.set_visible(False), ax2.axes.yaxis.set_visible(False)

    root = tk.Tk()
    root.geometry("1410x600")

    Canvas = FigureCanvasTkAgg(fig, master=root)
    Canvas.get_tk_widget().grid(row=0, column=0, rowspan=10)

if __name__ == "__main__":
    main()
続いてスライダー(tkinterではスケールと言います)の作成及び、設定をしたいと思います。
設定を始める前に知っておいてもらいたい事があります。
それは、スライダーという部品を構成するコードと、スライダーの値を格納するオブジェクトが必要だという事です。なので、まずは格納するオブジェクトを設定しておいて、その後スライダーの部品構成の中で値を格納するオブジェクトを指定しておく必要があります。
まず、オブジェクトを生成します。
オブジェクト名 = tk.IntVar()
IntVar()とは、整数値であるという事を宣言しています。
続いて、スライダー(スケール)部品の設定です。
変数名 = tk.Scale(オプション)
で設定を行います。オプションは以下となります。
| 第1引数 | 配置場所 |
| label | スケールのラベル |
| from_ | スケールの最小値 |
| to | スケールの最大値 |
| orient | 配置方向 tkinter.HORIZONTAL tkinter.VERTICAL(デフォルト) |
| length | スケールの長さです。 |
| showvalue | 値の表示、非表示 |
| variable | スケールの値を格納するインスタンス名 |
| command | 値が変更した時の実行関数 |
| resolution | 解像度 |
配置場所は、tkinterのcanvasとなりますのでrootとなります。
labelはウインドレベルと、ウインドウ幅、スレッショルドのスケールを作成しますのでそれぞれ、’Window Level ’、’Window Width’、’Threshold’としましょう。
スケールの最小値は、ウインドウ幅は0,ウインドウレベルとスレッショルドは画像信号値の最小値とします。
スケールの最大値は、ウインドウ幅には画像信号値の最小値から最大値までの半分、ウインドウレベル、スレッショルドは、画像信号値の最大値
orientは横方向としますので、tk.HORIZONTAL
長さは200ピクセルとします。
コマンドは、ウインドウ幅、ウインドウレベルで共有した関数windowを作成、スレッショルドは関数thresholdで作成します。
残りの引数の指定は省略してしまいましょう。
それでは、コードです。
まずはウインドウレベルから
var_scale_level = tk.IntVar()

level_sc = tk.Scale(root,
    label='Window Level',
    variable=var_scale_level,
    orient=tk.HORIZONTAL,
    length=200,
    from_= np.min(img_arr),
    to=np.max(img_arr),
    command=window)

level_sc.set(w_level)

level_sc.grid(row=1, column=1)
同様にウインドウ幅
var_scale_w_width = tk.IntVar()

w_width_sc = tk.Scale(root,
    label = 'Window Width',
    variable=var_scale_w_width,
    orient=tk.HORIZONTAL,
    length=200,
    from_=0,
    to=(np.max(img_arr) - np.min(img_arr))//2,
    command=window)

w_width_sc .set(w_width)

w_width_sc.grid(row=3, column=1)
スレッショルドは
thre = 0

var_thre = tk.IntVar()
thre_sc = tk.Scale(root,
label='Threshold',
variable=var_thre,
orient=tk.HORIZONTAL,
length=200,
from_=np.min(img_arr),
to=np.max(img_arr),
command=thresho)
thre_sc.set(thre)
thre_sc.grid(row=5, column=1)
ここまでのコードです
import pydicom
import fileselect as fs
import matplotlib.pyplot as plt
from matplotlib.backends.backend_tkagg import FigureCanvasTkAgg
import numpy as np

def main():

    filename = fs.single_fileselect()
    dcm = pydicom.dcmread(filename)
    img_arr = dcm.pixel_array
    w_level = int(dcm[0x0028, 0x1050].value)
    w_width = int(dcm[0x0028, 0x1051].value)

    fig = plt.figure(figsize=(12, 6))
    ax1 = fig.add_subplot(1, 2, 1)
    ax2 = fig.add_subplot(1, 2, 2)

    ax1.axes.xaxis.set_visible(False), ax1.axes.yaxis.set_visible(False)
    ax2.axes.xaxis.set_visible(False), ax2.axes.yaxis.set_visible(False)

    root = tk.Tk()
    root.geometry("1410x600")

    Canvas = FigureCanvasTkAgg(fig, master=root)
    Canvas.get_tk_widget().grid(row=0, column=0, rowspan=10)

    var_scale_level = tk.IntVar()
    level_sc = tk.Scale(root,
        label='Window Level',
        variable=var_scale_level,
        orient=tk.HORIZONTAL,
        length=200,
        from_= np.min(img_arr),
        to=np.max(img_arr),
        command=window)
    level_sc.set(w_level)
    level_sc.grid(row=1, column=1)

    var_scale_w_width = tk.IntVar()
    w_width_sc = tk.Scale(root,
        label = 'Window Width',
        variable=var_scale_w_width,
        orient=tk.HORIZONTAL,
        length=200,
        from_=0,
        to=(np.max(img_arr) - np.min(img_arr))//2,
        command=window)
        w_width_sc .set(w_width)
        w_width_sc.grid(row=3, column=1)


    var_thre = tk.IntVar()
    thre_sc = tk.Scale(root,
        label='Threshold',
        variable=var_thre,
        orient=tk.HORIZONTAL,
        length=200,
        from_=np.min(img_arr),
        to=np.max(img_arr),
        command=thresho)
        thre_sc.set(thre)
        thre_sc.grid(row=5, column=1)

if __name__ == "__main__":
    main()
スケール(スライダー)変更時の動作設定
スケールは3つ作成しましたが、関数はウインドウレベル、ウインドウ幅を変更した時の関数と、スレッショルドを変更した時の関数の2つを作成します。
まずは、ウインドウ幅、ウインドウレベルを変更した時の関数です。
matplotlibで画像を表示する際に、表示信号幅はvmin,vmaxで指定します。
ax1.imshow(img_arr, cmap=’bone’, vmin=ww_low, vmax=ww_high)
表示の最小値、最大値ですので、ウインドウレベルとウインドウ幅から最小値と最大値を計算しなければなりません。
それら計算は初めの画像表示時とウインドウレベル、ウインドウ幅のスケールを変更した時と何回も使用しますので、これも関数化しておきましょう。
関数名はlevel()として作成してみました。
def level():
    global ww_low, ww_high, w_level, w_width

    window_level, window_width = level_sc.get(), w_width_sc.get()

    ww_low = window_level - (window_width // 2)
    ww_high = window_level + (window_width // 2)
スケールの値をそれぞれ、window_level, window_widthとして取得します。その後、ww_low, ww_highとして計算します。
スケールの値はget()関数で取得します。上記コードでは1行で取得していますが
window_level = level_sc.get()
window_width = w_width_sc.get()
という感じです。
window_level, window_width, ww_low, ww_highは他の関数とも共有しますのでglobal宣言しておきます。(上記コード2行目)メイン関数の方でも同様にglobal宣言を足しておきましょう。
それでは、まずウインドウ幅、ウインドウレベルのスケールを変更した時の処理に入ります。
関数名はwindow()としました。
スケール指定される関数は、引数としてスケールの値が返されますので、関数の引き受ける引数としてself(名前はなんでもOK)を指定しておきます。
def window(self):
ってかんじです。
しかし、今回は2つのスケールから共通の関数として作成しているのでこの引数は使用しません。
まずは、この関数が呼び出された時に先ほど作成した関数level()でww_lowとww_highの値を計算させましょう。
level()
で、先ほどの関数を呼び出します。ただ、この関数内でもww_lowとww_highをglobal宣言しておかないと計算結果を使えませんので忘れずに宣言しておいてください。
後は、matplotlibの表示設定です。左側に元画像を表示するのでax1に設定します。
ax1.imshow(img_arr, cmap=’bone’, vmin=ww_low, vmax=ww_high)
続いて、figの更新するコードこれを忘れては表示が更新されませんので忘れずに。
fig.canvas.draw()
続いて閾値設定の関数です。関数名はthreshold()で作成します。
先ほど同様、スケールの値が引数と渡されますので
def threshold(self):
としておきます。
閾値設定は前々回の記事で書いていますのでご覧ください。
import pydicom
import fileselect as fs
import matplotlib.pyplot as plt
from matplotlib.backends.backend_tkagg import FigureCanvasTkAgg
import numpy as np

def level():
    global ww_low, ww_high, w_level, w_width

    window_level, window_width = level_sc.get(), w_width_sc.get()

    ww_low = window_level - (window_width // 2)
    ww_high = window_level + (window_width // 2)

def window(self):
    global ww_low, ww_high, img_arr, ax1

    level()

    ax1.imshow(img_arr, cmap='bone', vmin=ww_low, vmax=ww_high)
    fig.canvas.draw()

def thresho(self):
    global img_arr, ax2, fig

    ret, thresh = cv2.threshold(img_arr, int(self), 255, cv2.THRESH_BINARY)
    ax2.imshow(thresh, cmap='bone')

    fig.canvas.draw()

def main():
    global ww_low, ww_high, img_arr_copy, thre_sc, ax2, fig, img_arr, ax1, level_sc, w_width_sc, ww_low, ww_high, w_level, w_width

    filename = fs.single_fileselect()
    dcm = pydicom.dcmread(filename)
    img_arr = dcm.pixel_array
    w_level = int(dcm[0x0028,0x1050].value)
    w_width = int(dcm[0x0028, 0x1051].value)

    fig = plt.figure(figsize=(12, 6))
    ax1 = fig.add_subplot(1, 2, 1)
    ax2 = fig.add_subplot(1, 2, 2)

    ax1.axes.xaxis.set_visible(False), ax1.axes.yaxis.set_visible(False)
    ax2.axes.xaxis.set_visible(False), ax2.axes.yaxis.set_visible(False)

    root = tk.Tk()
    root.geometry("1410x600")

    Canvas = FigureCanvasTkAgg(fig, master=root)
    Canvas.get_tk_widget().grid(row=0, column=0, rowspan=10)

    var_scale_level = tk.IntVar()
    level_sc = tk.Scale(root,
        label='Window Level',
        variable=var_scale_level,
        orient=tk.HORIZONTAL,
        length=200,
        from_= np.min(img_arr),
        to=np.max(img_arr),
        command=window)
    level_sc.set(w_level)
    level_sc.grid(row=1, column=1)

    var_scale_w_width = tk.IntVar()
    w_width_sc = tk.Scale(root,
        label = 'Window Width',
        variable=var_scale_w_width,
        orient=tk.HORIZONTAL,
        length=200,
        from_=0,
        to=(np.max(img_arr) - np.min(img_arr))//2,
        command=window)
        w_width_sc .set(w_width)
        w_width_sc.grid(row=3, column=1)


    var_thre = tk.IntVar()
    thre_sc = tk.Scale(root,
        label='Threshold',
        variable=var_thre,
        orient=tk.HORIZONTAL,
        length=200,
        from_=np.min(img_arr),
        to=np.max(img_arr),
        command=thresho)
        thre_sc.set(thre)
        thre_sc.grid(row=5, column=1)

if __name__ == "__main__":
    main()
仕上げ
いよいよ、仕上げ作業です。
画像を読み込んだ際に先ほど作成した関数を呼び出さなければ画像表示できませんので、それを付け加えていきたいと思います。
上記コードmain関数の最後にウインドウ幅とウインドウレベルのスケールを変更した時の関数を呼び出しましょう。ただ、何か引数を与えないとエラーとなってしまいますので適当に1を渡しておきます。
同様に、閾値設定した画像を表示する関数を呼び出します。
window(1)
thresho(1)
これで完成となります。
完成コード
import tkinter as tk
import cv2
import matplotlib.pyplot as plt
from matplotlib.backends.backend_tkagg import FigureCanvasTkAgg
import numpy as np
import pydicom
import fileselect as fs


def level():
    global ww_low, ww_high, w_level, w_width

    window_level, window_width = level_sc.get(), w_width_sc.get()

    ww_low = window_level - (window_width // 2)
    ww_high = window_level + (window_width // 2)

def window(self):
    global ww_low, ww_high, img_arr, ax1

    level()

    ax1.imshow(img_arr, cmap='bone', vmin=ww_low, vmax=ww_high)
    fig.canvas.draw()

def thresho(self):
    global img_arr, ax2, fig

    ret, thresh = cv2.threshold(img_arr, int(self), 255, cv2.THRESH_BINARY)
    ax2.imshow(thresh, cmap='bone')

    fig.canvas.draw()


def main():
    global ww_low, ww_high, img_arr, thre_sc, ax2, fig,\
        img_arr, ax1, level_sc, w_width_sc, ww_low, ww_high, w_level, w_width


    filename = fs.single_fileselect()
    dcm = pydicom.dcmread(filename)
    img_arr = np.array(dcm.pixel_array)
    w_level = int(dcm[0x0028,0x1050].value)
    w_width = int(dcm[0x0028, 0x1051].value)

    fig = plt.figure(figsize=(12, 6))
    ax1 = fig.add_subplot(1, 2, 1)
    ax2 = fig.add_subplot(1, 2, 2)

    ax1.axes.xaxis.set_visible(False), ax1.axes.yaxis.set_visible(False)
    ax2.axes.xaxis.set_visible(False), ax2.axes.yaxis.set_visible(False)


    root = tk.Tk()
    root.geometry("1410x600")

    Canvas = FigureCanvasTkAgg(fig, master=root)
    Canvas.get_tk_widget().grid(row=0, column=0, rowspan=10)


    var_scale_level = tk.IntVar()
    level_sc = tk.Scale(root,
        label='Window Level',
        variable=var_scale_level,
        orient=tk.HORIZONTAL,
        length=200,
        from_= np.min(img_arr),
        to=np.max(img_arr),
        command=window)
    level_sc.set(w_level)
    level_sc.grid(row=1, column=1)

    var_scale_w_width = tk.IntVar()
    w_width_sc = tk.Scale(root,
        label = 'Window Width',
        variable=var_scale_w_width,
        orient=tk.HORIZONTAL,
        length=200,
        from_=0,
        to=(np.max(img_arr) - np.min(img_arr))//2,
        command=window)
    w_width_sc .set(w_width)
    w_width_sc.grid(row=3, column=1)


    thre = 0

    var_thre = tk.IntVar()
    thre_sc = tk.Scale(root,
        label='Threshold',
        variable=var_thre,
        orient=tk.HORIZONTAL,
        length=200,
        from_=np.min(img_arr),
        to=np.max(img_arr),
        command=thresho)
    thre_sc.set(thre)
    thre_sc.grid(row=5, column=1)

    window(1)
    thresho(1)

    root.mainloop()

if __name__ == "__main__":
    main()
最後に
いかがでしたか?きちんとコード動きましたか?
お疲れ様でした。
環境
- windows10
- python3.6.1
- Anaconda custom(64-bit)
- PyCharm2020.2(Communication Edition)
はじめに
こんにちは。でめきんです。
前々回、「tkinterでmatplotlibの画像を表示」という記事を書きましたが、今回は「openCVの画像を表示する」をやってみたいと思います。
openCVは画像処理や、動画を処理するライブラリーとなっていますので、tkinter上にopenCVで取り込んだ画像を表示できれば、tkinterのGUI機能であるボタン等に画像処理の機能を実装することが出来るようになります。
いわゆる、画像処理ソフト的なものを作成することが出来るかもしれません。
一見、openCVで取り込んだ画像をtkinterに表示ととらえられるかもしれませんが、実際はopenCVで取り込んだ画像をmatplotlibで表示。それをtkinter上に表示するという流れになります。
openCV自体にtkinterのGUI上に画像を表示させる機能は無いみたいです。ネット上ではopenCVで取り込んだ画像をPILLOWを用いてtkinter上に表示する記事が多いですが、我々診療放射線技師はmatplotlibを用いて表示した方が何かと便利だと思いますので今回はmatplotlibを用いた方法を紹介します。
流れ
前々回の記事での流れと同様となります。
- 画像をopenCVで読み込む
- matplotlibの表示設定を行う
- tkinterのcanvas設定を行う
注意点
今回注意しなければならない点が1点あります。
それは、openCVで取り込んだ画像はBlue,Green,RedのBGR順での色情報となっています。しかし、matplotlibやPILLOWではRed,Green,BlueのRGB順で色情報が入っていますので、その順番を変えてあげる必要があります。
ちなみに、入れ替えずに画像表示をすると以下の画像となります。
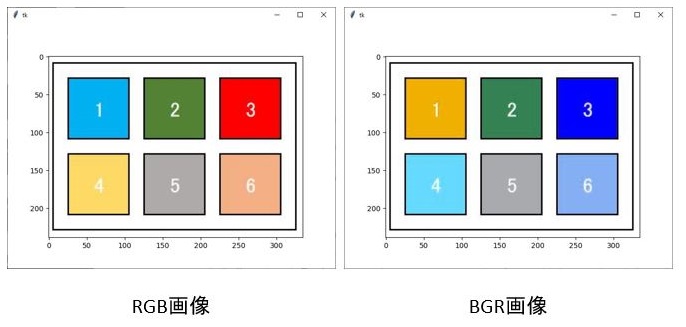
上の図を見てみると、「3」の背景色左のRGB画像では赤ですが、右のBGR画像では青に入れ替わっています。「1」と「4」の背景色も入れ替わっていますね。
それでは、どのように変更するかというと
img_rgb = cv2.cvtColor(img_bgr, cv2.COLOR_BGR2RGB)
cv2.cvtColorといったコードを用いて、BGRからRGBに変更することができます。
ちなみに、BGR2RGBの2はタイプミスではありませんのであしからず。toの意味です。ちなみにグレイスケールに変更する場合はBGR2GLAYでできます。
コード
完成コードは以下となります。
import tkinter
import cv2
import matplotlib.pyplot as plt
from matplotlib.backends.backend_tkagg import FigureCanvasTkAgg

root = tkinter.Tk()

img_bgr = cv2.imread("img.JPG")
img_rgb = cv2.cvtColor(img_bgr, cv2.COLOR_BGR2RGB) # BGRからRGBに変換

fig = plt.figure()
ax =fig.add_subplot()
ax = img_rgb

plt.imshow(img_rgb)

Canvas = FigureCanvasTkAgg(fig, master=root)
Canvas.get_tk_widget().grid(row=0, column=0)
root.mainloop()
最後に
いかがでしたか?
次回は、openCVの機能をtkinterのボタンウイジェットに組み込むという事をやってみたいと思います。
お疲れ様でした。
The post tkinterでopenCVの画像を表示 first appeared on 診療放射線技師がPythonをはじめました。.]]>はじめに
こんにちは、でめきんです。
今回は、tkinterを使ってmatplotlibの画像や、グラフを表示する方法を紹介したいと思います。
これを使うことでボタンや、エントリーボックスを設定することが出来、いわゆるソフト的な物を作成することが出来て非常に便利です。
それでは、やっていきましょう。
流れ
matplotlibで画像を表示する際には
① fig = plt.figure()
② ax = fig.add_subplot()
③ ax = ‘画像や配列’
④ plt.show()
で画像表示をしていくわけですが、tkinterを用いて画像表示する際には
④が変わってきます。
使うコード
使用するコードは
FigureCanvasTkAgg(fig, master=root)
となります。
Canvas = FigureCanvasTkAgg(fig, master=root)
引数部分は(matplotlibで設定したfig , tkinterで作成した領域)となります。
実際のコード
まずは、matplotlibで画像表示
import matplotlib.pyplot as plt
from matplotlib.image import imread

img = imread("img.JPG")

fig = plt.figure()
ax =fig.add_subplot()
ax = img

plt.imshow(img)
plt.show()
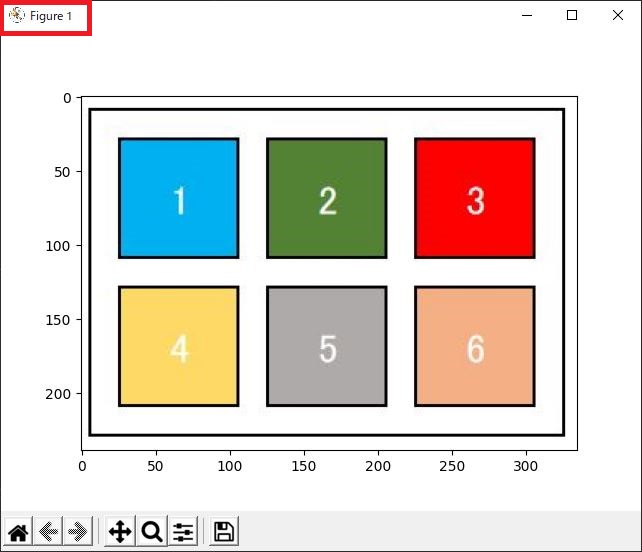
左上の部分を確認するとmatplotlibのマークが出ています。
続いて本題、tkinterを使ってmatplotlibの画像を表示してみたいと思います。
まず、必要なライブラリーのインポートします。
from matplotlib.backends.backend_tkagg import FigureCanvasTkAgg
がライブラリーのインポートとなります。
import tkinter
from matplotlib.backends.backend_tkagg import FigureCanvasTkAgg
tkinterとmatplotlibを紐づけるライブラリ
import matplotlib.pyplot as plt
from matplotlib.image import imread

img = imread("img.JPG")
fig = plt.figure()
ax =fig.add_subplot()
ax = img
plt.imshow(img)
#plt.show()

root = tkinter.Tk()
root.title("tkinterでmatplotの画像表示")
Canvas = FigureCanvasTkAgg(fig, master=root)
Canvas.get_tk_widget().grid(row=0, column=0)
root.mainloop()
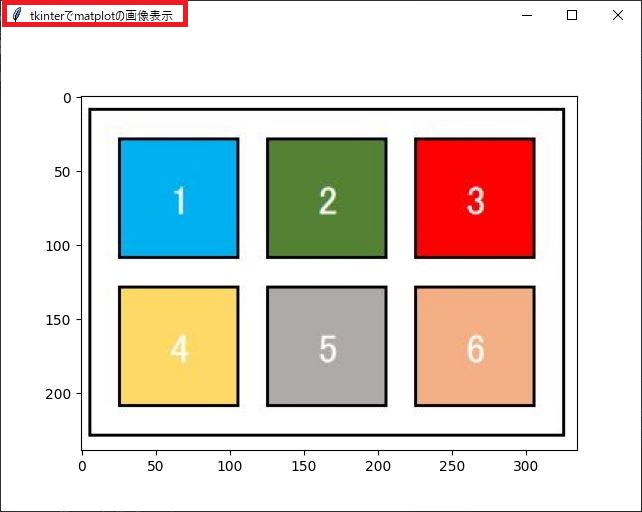
左上の羽のマークがtkinterという証拠になります。
最後に
いかがでしたか?
tkinterを用いることで、GUIの作成ができるようになります。
ボタン等いろんなものを設置して、アプリを作成することが出来るようになるとプログラミングがもっと楽しくなってきますよね。
是非とも試してください。
The post tkinterでmatplotlibの画像を表示 first appeared on 診療放射線技師がPythonをはじめました。.]]>はじめに
今回の記事は前回の記事の続きになっております。
まだご覧になっていない方はこちらからどうぞ。
前回のコードは以下になります。
# -- coding utf-8 --

import tkinter
from tkinter import ttk

def matplot_show():
    pass


# メインウィンドウ
main_win = tkinter.Tk()
main_win.title("matplotlib 領域")
main_win.geometry("230x210")

# メインフレーム
main_frm = ttk.Frame(main_win)
main_frm.grid(column=0, row=0, sticky=tkinter.NSEW)

#ラベルの作成
fig_label = ttk.Label(main_frm, text="figsize",width =10)
ax_label = ttk.Label(main_frm, text="axの数",width =10)
ax_area_row = ttk.Label(main_frm, text="余白設定",width =10)
ax_space = ttk.Label(main_frm, text="画像間隔",width =10)

#Entryの作成
fig_row,fig_col = ttk.Entry(main_frm,width =5,justify="center"),ttk.Entry(main_frm,width =5,justify="center")
ax_box_row,ax_box_col = ttk.Entry(main_frm,width =5,justify="center"),ttk.Entry(main_frm,width =5,justify="center")
ax_area_l,ax_area_r = ttk.Entry(main_frm,width =5,justify="center"),ttk.Entry(main_frm,width =5,justify="center")
ax_area_u,ax_area_d = ttk.Entry(main_frm,width =5,justify="center"),ttk.Entry(main_frm,width =5,justify="center")
ax_space_hspace,ax_space_wspace = ttk.Entry(main_frm,width =5,justify="center"), ttk.Entry(main_frm,width =5,justify="center")

#ボタンの作成
app_btn = ttk.Button(main_frm, text="実行",command = matplot_show)

fig_label.grid(row=1, column=0)
fig_row.grid(row=1, column=1)
fig_col.grid(row=1, column=2,columnspan=2)

ax_label.grid(row=2, column=0)
ax_box_row.grid(row=2, column=1)
ax_box_col.grid(row=2, column=2,columnspan=2)

ax_area_u.grid(row=3,column=2)

ax_area_row.grid(row=4,column=0)
ax_area_l.grid(row=4,column=1)
ax_area_r.grid(row=4,column=3)

ax_area_d.grid(row=5,column=2)

ax_space.grid(row=6,column=0)
ax_space_hspace.grid(row=6,column=1)
ax_space_wspace.grid(row=6,column=2,columnspan=2)

app_btn.grid(row=7, column=0,columnspan=4)

fig_row.insert(0,"4"),fig_col.insert(0,"5")
ax_box_row.insert(0,"2"),ax_box_col.insert(0,"2")
ax_area_l.insert(0,"0"),ax_area_r.insert(0,"1")
ax_area_u.insert(0,"1"),ax_area_d.insert(0,"0")
ax_space_hspace.insert(0,"0.1"),ax_space_wspace.insert(0,"0.1")

main_win.mainloop()
tkinter Entryの値を取得する方法
前回の記事でEntryウイジェットを用いて値を入力できるようにしましたが、その値を取得する方法を紹介したいと思います。
これからのコードはmatplot_showの関数部分になりますので
passの文字を消してその部分に入力していきます。
忘れないうちにmatplotのインポートを忘れずに
import matplotlib.pyplot as plt
取得する方法は .get() を用い
変数名 = Entryウイジェット名.get()
で取得可能になります。
    fig__row = int(fig_row.get())
    fig_column = int(fig_col.get())
    ax_row = int(ax_box_row.get())
    ax_col = int(ax_box_col.get())
    ax_area_le = float(ax_area_l.get())
    ax_area_ri = float(ax_area_r.get())
    ax_area_up = float(ax_area_u.get())
    ax_area_do = float(ax_area_d.get())
    ax_space_h = float(ax_space_hspace.get())
    ax_space_w = float(ax_space_wspace.get())
ちなみに、初めの fig__row はタイプミスではありません。Entryウイジェットと同じ変数名は指定できない為、わざとアンダーバーを2つ重ねています。
Entryの数値は整数型、浮動小数点型の指定をして受けることにします。matplotlibのfig,axesの設定の際にエラーになるのを避けるために指定します。
matplotlibのfig,axesの設定
それでは、matplotlibの設定に入っていきます。
fig,axes = plt.subplots(縦の画像数,縦の画像数,figsize=(縦のサイズ, 横のサイズ))
ですのでそれぞれにEntryウイジェットから取得した変数名を入れていきます。
fig, axes = plt.subplots(ax__row, ax_col, figsize=(fig__row, fig_column)) 画像配置の設定に入る前に一つ準備をします。
画像の配置は縦方向に何番目、横方向に何番目と数字で指定しますので、その為1から縦方向の画像配置数の配列を作成します。横方向にも同様に作成します。私はnumpyが使いやすいのでnumpyをインポートして作成したいと思います。
ax_row_n = np.arange(0, ax_row) + 1
ax_col_n = np.arange(0, ax_col) + 1
それぞれの配列に1を足しているのは、配列の初めは0となってしまいますので配列作成後にそれぞれの要素に1を足してあげています。
続いて、画像配置の番号です。
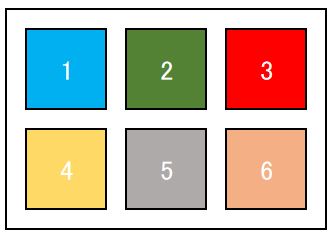
画像番号は図のように1から順番に設定していきますので、一つposという変数を1で設定しておきます。
それでは、画像の配置設定に入ります。for文で一つ一つ設定していきます。
pos = 1

for i in range(len(ax_row_n)):
    for j in range(len(ax_col_n)):
        axes[i][j] = fig.add_subplot(ax_row, ax_col, pos)
        pos += 1
これで、配置設定まで終わりました。
最後に画像表示のコード
plt.show()
を入力して動かしてみましょう。
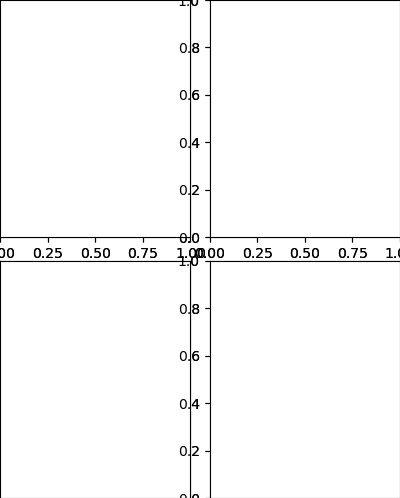
上記の様な画面が出ましたか?
ちょっと味気ないので色を付けてみたいと思います。色のリストを作成します。
ちなみに、表示画像数が多くなると、このリストの要素数を超えてしまいエラーになるので多めに作成しておきましょう。このリストは8色を巡回しているだけです。
color_mp =['b', 'g', 'r', 'c', 'm', 'y', 'k', 'w','b', 'g', 'r', 'c', 'm', 'y', 'k', 'w','b', 'g', 'r', 'c', 'm', 'y', 'k', 'w','b', 'g', 'r', 'c', 'm', 'y', 'k', 'w','b', 'g', 'r', 'c', 'm', 'y', 'k', 'w','b', 'g', 'r', 'c', 'm', 'y', 'k', 'w']
関数を宣言している真下にでも追加しておいてください。
続いて、色を付ける設定です。
先ほどのfor文の中で配置設定をした下に
axes[i][j].set_facecolor(color_mp[pos-1])
を記入して完成です。
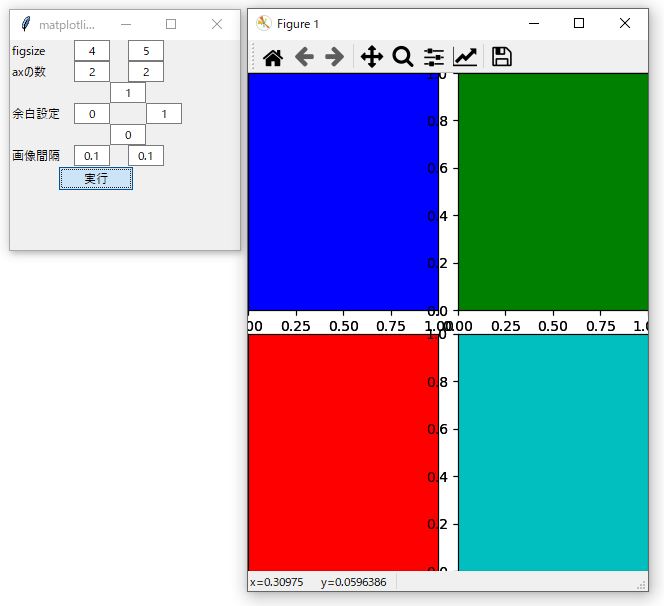
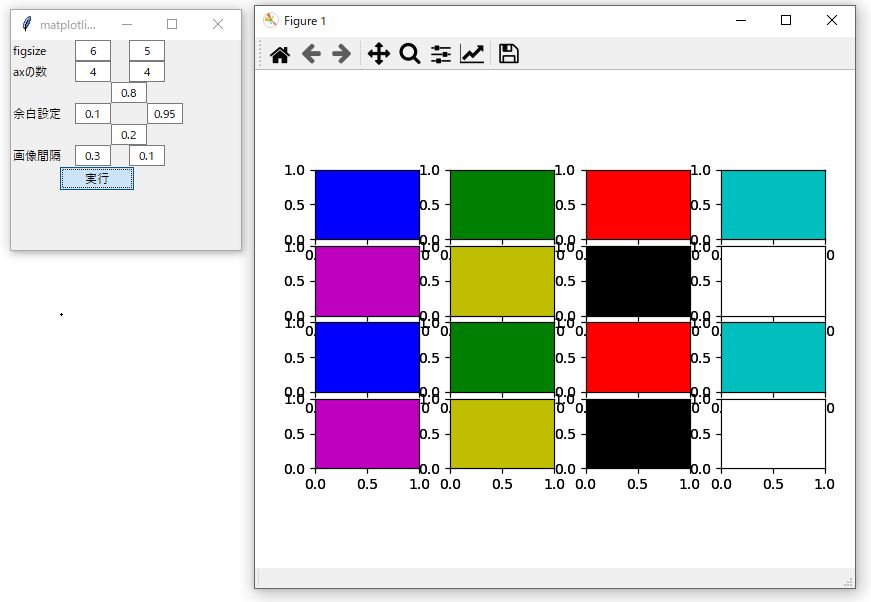
完成したコードは以下になります。
# -- coding utf-8 --

import tkinter
from tkinter import ttk
import matplotlib.pyplot as plt
import numpy as np

def matplot_show():
    color_mp =['b', 'g', 'r', 'c', 'm', 'y', 'k', 'w','b', 'g', 'r', 'c', 'm', 'y', 'k', 'w','b', 'g', 'r', 'c', 'm', 'y', 'k', 'w','b', 'g', 'r', 'c', 'm', 'y', 'k', 'w','b', 'g', 'r', 'c', 'm', 'y', 'k', 'w','b', 'g', 'r', 'c', 'm', 'y', 'k', 'w']

    fig__row = int(fig_row.get())
    fig_column = int(fig_col.get())
    ax_row = int(ax_box_row.get())
    ax_col = int(ax_box_col.get())
    ax_area_le = float(ax_area_l.get())
    ax_area_ri = float(ax_area_r.get())
    ax_area_up = float(ax_area_u.get())
    ax_area_do = float(ax_area_d.get())
    ax_space_h = float(ax_space_hspace.get())
    ax_space_w = float(ax_space_wspace.get())

    fig, axes = plt.subplots(ax_row, ax_col, figsize=(fig__row, fig_column))

    ax_row_n = np.arange(0, ax_row) + 1
    ax_col_n = np.arange(0, ax_col) + 1

    plt.subplots_adjust(left=ax_area_le, right=ax_area_ri, bottom=ax_area_do, top=ax_area_up, wspace=ax_space_h, hspace=ax_space_w)

    pos = 1

    for i in range(len(ax_row_n)):
        for j in range(len(ax_col_n)):
            axes[i][j] = fig.add_subplot(ax_row, ax_col, pos)
            axes[i][j].set_facecolor(color_mp[pos-1])
            pos += 1

    fig.canvas.draw()
    plt.show()


# メインウィンドウ
main_win = tkinter.Tk()
main_win.title("matplotlib 領域")
main_win.geometry("230x210")

# メインフレーム
main_frm = ttk.Frame(main_win)
main_frm.grid(column=0, row=0, sticky=tkinter.NSEW)

#ラベルの作成
fig_label = ttk.Label(main_frm, text="figsize",width =10)
ax_label = ttk.Label(main_frm, text="axの数",width =10)
ax_area_row = ttk.Label(main_frm, text="余白設定",width =10)
ax_space = ttk.Label(main_frm, text="画像間隔",width =10)

#Entryの作成
fig_row,fig_col = ttk.Entry(main_frm,width =5,justify="center"),ttk.Entry(main_frm,width =5,justify="center")
ax_box_row,ax_box_col = ttk.Entry(main_frm,width =5,justify="center"),ttk.Entry(main_frm,width =5,justify="center")
ax_area_l,ax_area_r = ttk.Entry(main_frm,width =5,justify="center"),ttk.Entry(main_frm,width =5,justify="center")
ax_area_u,ax_area_d = ttk.Entry(main_frm,width =5,justify="center"),ttk.Entry(main_frm,width =5,justify="center")
ax_space_hspace,ax_space_wspace = ttk.Entry(main_frm,width =5,justify="center"), ttk.Entry(main_frm,width =5,justify="center")

#ボタンの作成
app_btn = ttk.Button(main_frm, text="実行",command = matplot_show)

fig_label.grid(row=1, column=0)
fig_row.grid(row=1, column=1)
fig_col.grid(row=1, column=2,columnspan=2)

ax_label.grid(row=2, column=0)
ax_box_row.grid(row=2, column=1)
ax_box_col.grid(row=2, column=2,columnspan=2)

ax_area_u.grid(row=3,column=2)

ax_area_row.grid(row=4,column=0)
ax_area_l.grid(row=4,column=1)
ax_area_r.grid(row=4,column=3)

ax_area_d.grid(row=5,column=2)

ax_space.grid(row=6,column=0)
ax_space_hspace.grid(row=6,column=1)
ax_space_wspace.grid(row=6,column=2,columnspan=2)

app_btn.grid(row=7, column=0,columnspan=4)

fig_row.insert(0,"4"),fig_col.insert(0,"5")
ax_box_row.insert(0,"2"),ax_box_col.insert(0,"2")
ax_area_l.insert(0,"0"),ax_area_r.insert(0,"1")
ax_area_u.insert(0,"1"),ax_area_d.insert(0,"0")
ax_space_hspace.insert(0,"0.1"),ax_space_wspace.insert(0,"0.1")

main_win.mainloop()
最後に
シュミレーションできましたか?コードが不完全でFigureの閉じるボタンを押さないと変更を変えられませんが、ご勘弁を。
また、余白設定は最大値1です。左側より右側が、下より上の数値が大きくなってもエラーが出ます。
画像数がカラーリストの要素数を超えてもエラーができます。
お時間がある方はエラー処理を追加して完成を目指してください。
お疲れ様でした。
The post tkinterのGUIを使ってmatplotlibのfigやaxesの配置をシュミレーションできるプログラムを組んでみた② first appeared on 診療放射線技師がPythonをはじめました。.]]>はじめに
皆さん、こんにちは。
でめきんです。
今回は、matplotlibを用いたグラフや、画像の配置設定についてやってみたいと思います。
追加
配置設定のシュミレーションソフトを作成してみました。ちょっと粗削りですが、良かったら試してみてください。
tkinterのGUIを使ってmatplotlibのfigやaxesの配置をシュミレーションできるプログラムを組んでみた①
tkinterのGUIを使ってmatplotlibのfigやaxesの配置をシュミレーションできるプログラムを組んでみた②
figやaxとは
前回の記事でもちょろっと記載しましたが、考え方としては何もないところで絵を描こうとするときにまずは、画板や机を準備すると思います。それがfigにあたります。その後、その上に絵を描く紙を準備すると思います。それがaxにあたると考えやすいと思います。
figの設定は
fig = plt.figure()
チュートリアルはこちら
axの設定は
ax = fig.add_subplot()
で設定していきます。チュートリアルはこちら。
fig内に複数の画像やグラフを表示したい時には
一つのfigの中に何個か画像を書きたい時には以下の様にaxを追加していきます。ちなみに、axと名前を付けていますがこれは変数名なので好きな文字で構いません。
ax1 = fig.add_subplot()
ax2 = fig.add_subplot()
ax3 = fig.add_subplot()
では、それぞれのグラフをどこに配置するかの設定をしてみたいと思います。
その設定はaxの引数としてカッコ内に指定します。
カッコ内にはまずfig内の縦、横方向の配置を記し、最後にaxが何番目に画像が入るかを指定します。左上から右方向に数えていきます。(下の画像の表示番号を参考にしてください)
fig.add_subplot(縦の画像数,横の画像数,表示番号)
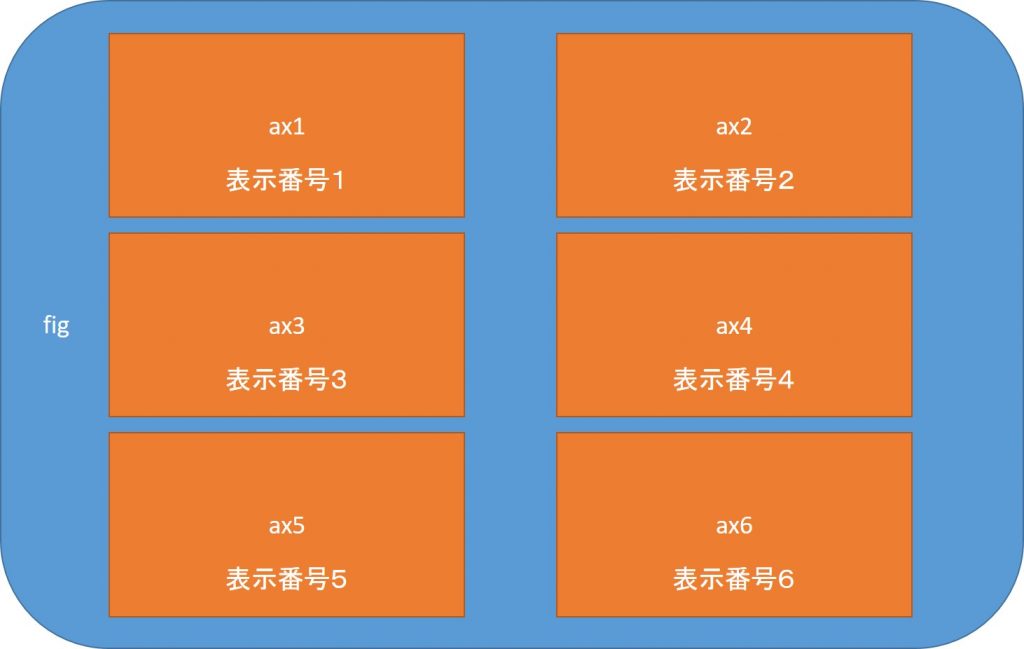
ax5の設定であれば上記図で縦方向に3、横方向に2枚の画像があります。そして表示場所は表示番号5となりますので設定は以下のようになります。
ax5 = fig.add_subplot(3,2,5)
ちなみに引数内のカンマを無くして以下の様に記載してもOKです。
ax5 = fig.add_subplot(325)
でも、ちょっと分かりずらいですね。。。。。
figの大きさを決める
figの大きさを指定することができます。
設定はfig設定の引数内にfigsize = ()でします。
fig = plt.figure(figsize = ( 15 , 5))
の様に指定しますが、ここで注意が必要なのが、設定は(横のサイズ,縦のサイズ)という事です。
単位はインチです。デフォルトのサイズは(6.4 , 4.8)です。
axの大きさを決める
axの大きさはfigの左下を原点として
ax.set_position([図のx座標 , 図のy座標 , 幅 , 高さ])
で決めます。なお、全体を1とした比率で設定します。ちょっとややっこしいですよね・・・・・
軸の設定
画像を表示した際、軸であったり軸のメモリだったりを表示したくない場合があると思います。それを非表示にするには
ax.axes.xaxis.set_visible
や
ax.axes.yaxis.set_visible
を使用します。
最後に
matplotlibの表示設定に関してはちょっと理解しにくいところがあります。私自身もまだまだ、理解できていません。皆さん、頑張っていきましょう!!
The post matplotlib、グラフや画像の配置設定について first appeared on 診療放射線技師がPythonをはじめました。.]]>はじめに
プログラムを組んでいて、あるキーを押したらこんな動作を組みたいなと思うことがあったのですが、キーイベントの記事がなかなか見つからなくて苦労したので、今回はそれを書いていこうと思います。
キーイベントとは
キーイベントとはキーボード上のキーを押したことによって動作を決定することで、例えばF1キーを押すことで、画像のWW,WLを頭部の条件に設定する、F2キーで肺野条件にすることや、シフトキーを押しながらマウスホイールで画像拡大をする等の機能を設定することです。
今回は、簡単なF1キーを押すことで頭部条件、F2キーで肺野条件、F3キーで腹部条件、F4キーで骨条件を表示画像に適応する方法をやってみたいと思います。
イベント
キーボードのイベントは押された時と、離した時のイベントがあります。
- key_press_event : キーボードのキーが押された時
- key_release_event : キーボードのキーが離された時
イベントの設定は以下のコードで行います。
fig.canvas.mpl_connect('イベント名', イベントが発生した時の動作を記した関数)
今回は押した時のイベントだけ扱います。
コードを書く
まずは、コードの流れです。
- 画像取り込み
- イベント関数の設定
- 機能実装
- 複数回使うコードの整理
画像の取り込みから表示まで
まずは、pydicom、numpy、matplotlibのインポートと毎回用いているfileselectのモジュール、ピクセルデータを配列に取り込むクラスのコードをコピーしましょう。
そして、画像ファイルをフォルダで一括選択しそのパスをfilenamesの変数の取り込み、クラスに渡してピクセルデータを配列に取り込みます。その後、matplotlibで画像表示領域の設定、マウスホイールを使って画像を変えていくコードまで一気に設定してしまいましょう。
# -- coding utf-8 --
import pydicom
import numpy as np
import matplotlib.pyplot as plt
import fileselect as fs

class Pixarr:
    def __init__(self,filenames):
        dcm = pydicom.dcmread(filenames[0])

        self.row = dcm[0x0028,0x0010].value
        self.column = dcm[0x0028,0x0011].value
        self.ww = dcm[0x0028,0x1050].value
        self.wl = dcm[0x0028,0x1050].value

        self.pix_arr = np.zeros((len(filenames),self.row,self.column),
            dtype ='int16')

        if len(filenames) == 1:
            self.pix_arr = dcm.pixel_array
        else:
            for i in range(len(filenames)):
                dcm = pydicom.dcmread(filenames[i])
                img_no = dcm[0x0020,0x0013].value
                self.pix_arr[img_no-1] = dcm.pixel_array

def wheel_scroll(event):
    global sl

    if event.button == 'down':
        sl += 1
        if sl > len(filenames)-1:
            sl =0

    if event.button == 'up':
        sl -= 1
        if sl < 0:
            sl = len(filenames)-1

    ax.imshow(f0.pix_arr[sl], cmap='bone')

    fig.canvas.draw()

filenames = fs.folder_fileselect()
f0 = Pixarr(filenames)

sl = 0

fig = plt.figure()
ax = fig.add_subplot()

ax.imshow(f0.pix_arr[sl],cmap= 'bone')
fig.canvas.mpl_connect('scroll_event', wheel_scroll)
plt.show()
イベントで返される変数を調べる
それでは、キーイベントの設定をします。キーが押された時のイベントは
fig.canvas.mpl_connect('イベント名', イベントが発生した時の動作を記した関数)
で呼び出し、イベント名は ’key_press_event’ でした。
押した時の動作は、関数 ’key_press’ で書いていきましょう(関数名は何でも構いません)。まずは、キーが押された時、どのように変数が返ってくるのか確認します。
# -- coding utf-8 --
import pydicom
import numpy as np
import matplotlib.pyplot as plt
import fileselect as fs

class Pixarr:
    def __init__(self,filenames):
        dcm = pydicom.dcmread(filenames[0])

        self.row = dcm[0x0028,0x0010].value
        self.column = dcm[0x0028,0x0011].value
        self.ww = dcm[0x0028,0x1050].value
        self.wl = dcm[0x0028,0x1050].value

        self.pix_arr = np.zeros((len(filenames),self.row,self.column),
            dtype ='int16')

        if len(filenames) == 1:
            self.pix_arr = dcm.pixel_array
        else:
            for i in range(len(filenames)):
                dcm = pydicom.dcmread(filenames[i])
                img_no = dcm[0x0020,0x0013].value
                self.pix_arr[img_no-1] = dcm.pixel_array

def wheel_scroll(event):
    global sl

    if event.button == 'down':
        sl += 1
        if sl > len(filenames)-1:
            sl =0

    if event.button == 'up':
        sl -= 1
        if sl < 0:
            sl = len(filenames)-1

    ax.imshow(f0.pix_arr[sl], cmap='bone')

    fig.canvas.draw()

def key_press(event):
    print(event.key)

filenames = fs.folder_fileselect()
f0 = Pixarr(filenames)

sl = 0

fig = plt.figure()
ax = fig.add_subplot()

ax.imshow(f0.pix_arr[sl],cmap= 'bone')

fig.canvas.mpl_connect('scroll_event', wheel_scroll)
fig.canvas.mpl_connect('key_press_event', key_press)

plt.show()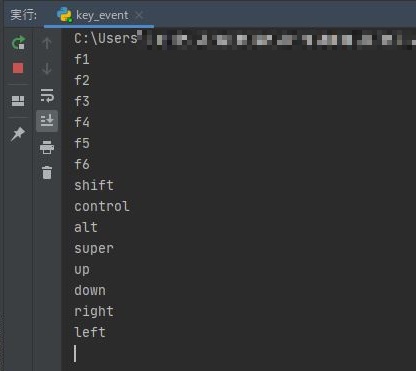
いかがでしたか?F1、F2、shiftキー等押すと上記図のような変数が返ってきます。ちなみに、’super’とはwindowsマークを押した時のeventです。
返ってくる変数が分かったので、機能を実装していきたいと思います。
機能の実装
それでは、機能を実装していきます。
まず、画像を表示するコード(上記コード56行目)ですが
ax.imshow(f0.pix_arr[sl], cmap='bone')の部分に、画像の最小値と、最大値を指定するコードを追加します。これは、画像のWWに当たるところですので変数名を最小値をww_L、最大値をww_Hとして指定したいと思います。
ax.imshow(f0.pix_arr[sl], vmin = ww_L , vmax = ww_H , cmap='bone')それでは、キーが押された時の設定に入ります。
CT画像のWL,WWの設定は以下のようにした場合
| WL | WW | |
| 頭部条件 | 35 | 70 |
| 肺野条件 | -600 | 1600 |
| 腹部条件 | 60 | 360 |
| 骨部条件 | 1500 | 3000 |
ww_Lとww_Hの設定はそれぞれ以下のようになります。
| ww_L | ww_H | |
| 頭部条件 | 0 | 70 |
| 肺野条件 | -1400 | 200 |
| 腹部条件 | -120 | 240 |
| 骨部条件 | 0 | 3000 |
上記条件をそれぞれF1に頭部条件,F2に肺野条件,F3に腹部条件,F4に骨条件として割り当てた場合
def key_press(event)の関数は以下となります。
def key_press(event):
    if event.key == "f1":
        ww_L , ww_H = 0 , 70

    if event.key == "f2":
        ww_L , ww_H = -1400 , 200

    if event.key == "f3":
        ww_L , ww_H = -120 , 240

    if event.key == "f4":
        ww_L , ww_H = 0 , 3000
そして、画像表示のコード
ax.imshow(f0.pix_arr[sl], vmin = ww_L , vmax = ww_H , cmap='bone')

fig.canvas.draw()
を付け足してあげることで画像条件を変更するプログラムは完成です。
# -- coding utf-8 --
import pydicom
import numpy as np
import matplotlib.pyplot as plt
import fileselect as fs

class Pixarr:
    def __init__(self,filenames):
        dcm = pydicom.dcmread(filenames[0])

        self.row = dcm[0x0028,0x0010].value
        self.column = dcm[0x0028,0x0011].value
        self.ww = dcm[0x0028,0x1050].value
        self.wl = dcm[0x0028,0x1050].value

        self.pix_arr = np.zeros((len(filenames),self.row,self.column),
            dtype ='int16')

        if len(filenames) == 1:
            self.pix_arr = dcm.pixel_array
        else:
            for i in range(len(filenames)):
                dcm = pydicom.dcmread(filenames[i])
                img_no = dcm[0x0020,0x0013].value
                self.pix_arr[img_no-1] = dcm.pixel_array

def wheel_scroll(event):
    global sl

    if event.button == 'down':
        sl += 1
        if sl > len(filenames)-1:
            sl =0

    if event.button == 'up':
        sl -= 1
        if sl < 0:
            sl = len(filenames)-1

    ax.imshow(f0.pix_arr[sl], cmap='bone')

    fig.canvas.draw()

def key_press(event):
    if event.key == "f1":
        ww_L , ww_H = 0 , 70

    if event.key == "f2":
        ww_L , ww_H = -1400 , 200

    if event.key == "f3":
        ww_L , ww_H = -120 , 240

    if event.key == "f4":
        ww_L , ww_H = 0 , 3000

    ax.imshow(f0.pix_arr[sl], vmin = ww_L , vmax = ww_H , cmap='bone')

    fig.canvas.draw()


filenames = fs.folder_fileselect()
f0 = Pixarr(filenames)

sl = 0

fig = plt.figure()
ax = fig.add_subplot()

ax.imshow(f0.pix_arr[sl],cmap= 'bone')

fig.canvas.mpl_connect('scroll_event', wheel_scroll)
fig.canvas.mpl_connect('key_press_event', key_press)

plt.show()
皆さん、いかがでしたか?プログラムはきちんと動きましたか?
複数回使うコードは関数化
気づかれた方もいると思いますが、条件を変更してもマウスホイールで画像を切り替えてしまうとまた、条件が元に戻ってしまうんです。
何が原因かというと、画像を表示するコードが複数ある事で設定し忘れているところがあるんです。現在作成したコードでは41行目と、58行目に画像表示設定があるわけなのですが41行目にはvminとvmaxの指定をしていないのです。
この様に、同じコードを何度も使う場合はその部分を関数化してしまうのが間違いがなく、しかも設定が楽になりますので関数化してしまいましょう。
58行目から60行目までを関数化します。
def img_show():
    ax.imshow(f0.pix_arr[sl], vmin = ww_L , vmax = ww_H , cmap='bone')
    fig.canvas.draw()
上記関数を作成し、62行目辺りに入れます。(44行目に入れても構いません)
ただ、今の状態だとvminとvmaxの変数はkey_pressの中でだけ有効なので
global化しておきましょう。def img_show()とdef key_press(event)
の下に
global ww_L , ww_H と記載しておきます。
そして、41~43行目、58~60行目を
img_show()
と書き換えることで完成ですが、どうせなので、初期設定も腹部条件で表示させるようにも設定しておきましょう。
sl =0の所で一緒に設定してしまいましょう
sl , ww_L , ww_H = 0 , -120 , 240
71行目のコードを
img_show()
としてあげましょう。そうすることで画像表示の設定はimg_show()の関数内の設定だけで完了します。
完成コードを以下に示します。
# -- coding utf-8 --
import pydicom
import numpy as np
import matplotlib.pyplot as plt
import fileselect as fs


class Pixarr:
    def __init__(self, filenames):
        dcm = pydicom.dcmread(filenames[0])

        self.row = dcm[0x0028, 0x0010].value
        self.column = dcm[0x0028, 0x0011].value
        self.ww = dcm[0x0028, 0x1050].value
        self.wl = dcm[0x0028, 0x1050].value

        self.pix_arr = np.zeros((len(filenames), self.row, self.column),
                                dtype='int16')

        if len(filenames) == 1:
            self.pix_arr = dcm.pixel_array
        else:
            for i in range(len(filenames)):
                dcm = pydicom.dcmread(filenames[i])
                img_no = dcm[0x0020, 0x0013].value
                self.pix_arr[img_no - 1] = dcm.pixel_array


def wheel_scroll(event):
    global sl

    if event.button == 'down':
        sl += 1
        if sl > len(filenames) - 1:
            sl = 0

    if event.button == 'up':
        sl -= 1
        if sl < 0:
            sl = len(filenames) - 1

    img_show()


def key_press(event):
    global ww_L, ww_H
    if event.key == "f1":
        ww_L, ww_H = 0, 70

    if event.key == "f2":
        ww_L, ww_H = -1400, 200

    if event.key == "f3":
        ww_L, ww_H = -120, 240

    if event.key == "f4":
        ww_L, ww_H = 0, 3000

    img_show()

def img_show():
    global  ww_L, ww_H
    ax.imshow(f0.pix_arr[sl], vmin = ww_L , vmax = ww_H , cmap='bone')
    fig.canvas.draw()

filenames = fs.folder_fileselect()
f0 = Pixarr(filenames)

sl = 0
ww_L , ww_H = -120 , 240

fig = plt.figure()
ax = fig.add_subplot()


img_show()
#ax.imshow(f0.pix_arr[sl], cmap='bone')

fig.canvas.mpl_connect('scroll_event', wheel_scroll)
fig.canvas.mpl_connect('key_press_event', key_press)

plt.show()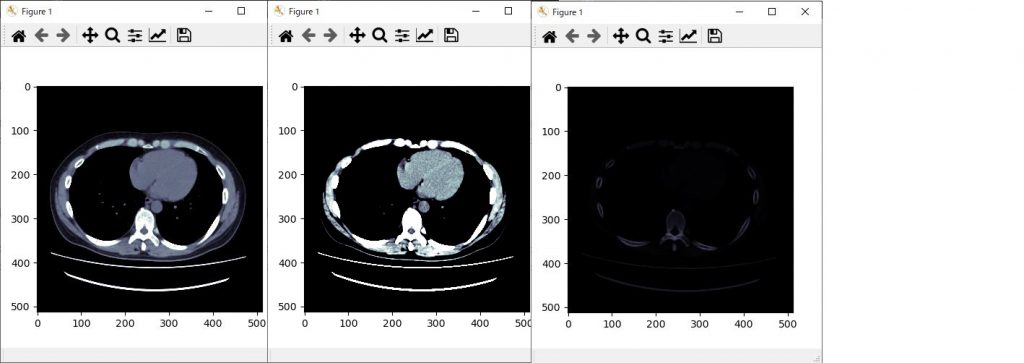
最後に
皆さんいかがでしたか?
今回は、ファンクションキーに画像条件のプリセット機能を付けてみましたが、その他にも、シフトキーを押しながらマウスホイールで画像拡大とか使い道はいろいろあります。
是非とも使ってみてくださいね。
お疲れ様でした。
環境
- windows10
- python3.6.1
- Anaconda custom(64-bit)
- PyCharm2020.2(Communication Edition)
はじめに
プログラムを組んでいる時、マウスを使って何かをしたいという事はとても多いと思います。そこで、今回はそのマウスコントロール(マウスイベント)を紹介したいと思います。
イベント
マウスイベントの種類としては、
- マウスをクリックを押した時
- マウスのクリックを離した時
- マウスホイールを回した時
の3つのイベントがあります。それぞれ
- button_press_event
- button_release_event
- scroll_event
と名前が付けられています。イベントを呼び出すコードは
fig.canvas.mpl_connect('イベント名', イベントが発生した時の動作を記した関数)
で呼び出します。よって、マウスをクリックした時、クリックを離した時、マウスホイールを回した時のイベント呼び出しは以下となります。
#クリック時
fig.canvas.mpl_connect('button_press_event', on_button_press)

#クリックを離した時
fig.canvas.mpl_connect('button_release_event', on_button_release)

#マウスホイールを回した時
fig.canvas.mpl_connect('scroll_event', wheel_scroll)
クリックした時、クリックを離した時のイベント
マウスには右クリック、マウスホイールクリック、左クリックの3種類があります。
OpenCvの場合は、それぞれが独立していますが、matplotlibでは、一つのイベントとしてまとめられています。
ではどのようにして区別しているかというと、左クリックをした時は”1”、マウスホイールを押した時は”2”、右クリックを押した時は”3”とevent.buttonという変数に番号が返されます。
なので、関数内に下の様なコードを記すことで機能を分けることができます。
def on_button_press(event): # マウスクリック
    if event.button == 1:
        ~~~ ~~~
    if event.button == 2:
        ~~~ ~~~
    if event.button == 3:
        ~~~ ~~~
それでは、簡単なコードを紹介します。
左クリックを押すころで背景色を”青”、マウスホイールを押すことで”白”、右クリックを押すことで”赤”に変えるプログラムを紹介します。
# -- coding utf-8 --

import matplotlib.pyplot as plt

def on_button_press(event):
    if event.button == 1:
        print(event)
        fig.patch.set_facecolor('blue')

    if event.button == 2:
        print(event)
        fig.patch.set_facecolor('white')

    if event.button == 3:
        print(event)
        fig.patch.set_facecolor('red')

    fig.canvas.draw()

fig = plt.figure()

fig.canvas.mpl_connect('button_press_event', on_button_press)
plt.show()
上記コードを実行すると以下のようになります。


eventの情報を表示したものになります。中にはダブルクリックの情報もありますので、ダブルクリックしたら背景色が”緑色”になるコードを追加してみたいと思います。(下記コード10行~13行目)
※dbclickではなく、dblclickです。lが入ることに注意してくださいね。
# -- coding utf-8 --

import matplotlib.pyplot as plt

def on_button_press(event):
    if event.button == 1:
        print(event)
        fig.patch.set_facecolor('blue')

    if event.button == 1 and event.dblclick == True:
        print(event)
        fig.patch.set_facecolor('green')

    if event.button == 2:
        print(event)
        fig.patch.set_facecolor('white')

    if event.button == 3:
        print(event)
        fig.patch.set_facecolor('red')

    fig.canvas.draw()

fig = plt.figure()

fig.canvas.mpl_connect('button_press_event', on_button_press)
plt.show()

いかがでしょうか?ダブルクリックの時の動作も指定することができました。
マウスホイールを回した時のイベント
次に、マウスホイールを回した時の処理について書いていきたいと思います。
マウスホイールのイベントは以下で呼び出します。
fig.canvas.mpl_connect('scroll_event', wheel_scroll)
マウスホイールを回した時の関数ないに、eventで返される値を表示するコードを24~25行目に追加します。
# -- coding utf-8 --

import matplotlib.pyplot as plt

def on_button_press(event):
    if event.button == 1:
        print(event)
        fig.patch.set_facecolor('blue')

    if event.button == 1 and event.dblclick == True:
        print(event)
        fig.patch.set_facecolor('green')

    if event.button == 2:
        print(event)
        fig.patch.set_facecolor('white')

    if event.button == 3:
        print(event)
        fig.patch.set_facecolor('red')

    fig.canvas.draw()

def wheel_scroll(event):
    print(event)

fig = plt.figure()

fig.canvas.mpl_connect('button_press_event', on_button_press)
fig.canvas.mpl_connect('scroll_event', wheel_scroll)
plt.show()
マウスホイールを回した時の動作はクリック時の時と同じevent.buttonの変数に”up”、”down”で返ってきいることが分かります。
サンプルコードです。
マウスホイールを回した時に背景色が変わるプログラムを作成します。
まずは、カラーリストを作成します。(下記コード28行目)
続いてcolの変数を宣言し(下記コード46行目)、その変数の番号によってリストにある色を背景色として指定します。(下記コード41行目)
colの変数のglobal化をお忘れなく(下記コード25行目)忘れてしまうと、マウスホイールを回しても変数が0でリセットされてしまいます。
後は、マウスホイールを回すことでcolの変数を変えるコードを書きます。(下記コード30~38行目)32~33行目、37~38行目はcolの変数がリストの要素数を超えた場合にリストの最初と、最後に戻すためのものです。
# -- coding utf-8 --

import matplotlib.pyplot as plt

def on_button_press(event):
    if event.button == 1:
        print(event)
        fig.patch.set_facecolor('blue')

    if event.button == 1 and event.dblclick == True:
        print(event)
        fig.patch.set_facecolor('green')

    if event.button == 2:
        print(event)
        fig.patch.set_facecolor('white')

    if event.button == 3:
        print(event)
        fig.patch.set_facecolor('red')

    fig.canvas.draw()

def wheel_scroll(event):
    global col
    print(event)

    colorlist = ["r", "g", "b", "c", "m", "y", "k", "w"]

    if event.button == "up":
        col -= 1
        if col == -1:
            col = 7

    if event.button == "down":
        col += 1
        if col == 7:
            col = 0

    print(col)
    fig.patch.set_facecolor(colorlist[col])
    fig.canvas.draw()


fig = plt.figure()
col = 0
fig.canvas.mpl_connect('button_press_event', on_button_press)
fig.canvas.mpl_connect('scroll_event', wheel_scroll)
plt.show()
いかがでしたか?マウスホイールを回すことで背景色が変わるプログラムはできましたか?
最後に
今回、クリックを離した時の動作の説明は省略させていただきましたが、クリックした時と同様ですので試してみてください。
マウスコントロールは、画像上でroiを設定したり、WW,WLの変更、マウスホイールは画像を切り替えてみたりと業務上でも常に使っている機能です。
この機能を設定できるようになればプログラムの幅も広がり楽しくなること間違いなしです。
是非、使ってみてください。
次回は、matplotlibで何かのキーを押した時のイベントをやってみたいと思います。
マウスコントロールが動かない場合はこれを試してみて!!
環境
- windows10
- python3.6.1
- Anaconda custom(64-bit)
- PyCharm2020.2(Communication Edition)
はじめに
今回は、業務中によく使用する画像間演算であるサブトラクションをやってみたいと思います。
コードの流れ
サブトラクションをやるには最低2枚の画像が必要となりますので、画像の読み込み工程を2つ作成します。その際、どちらの画像からどちらの画像を引き算するのか決めなくてはなりませんが、今回はコードを簡単にするため初めに取り込んだ画像から、2枚目に取り込んだ画像をひき算することにします。
続いて、計算結果を格納する配列を作成します。この配列は、取り込んだ画像と同じサイズの配列を作成します。
画像間演算、引き算のコードを書いていきます。
最後に、画像表示のコードを書いて完成となります。
コードを書いていく
画像のピクセルデータを取り込む
まずは、画像を読み込む工程からやっていきます。込みこむ工程は、画像のパスを変数に取り込んでから、それをクラスに渡して画像のピクセルデータを配列に取り込み形になります。
それではコードを書いていきたいと思います。
DICOM画像を使いますので、pydicomのインポートをします。
画像の読み込みは、毎回使用しているfileselectのモジュールを使用します。まだ、ご覧になっていない方はこちら。fileselectのファイルは、今回書いているコードと同じフォルダの中に入れておいてくださいね。
今回もフォルダで一括選択する方法で画像を読み込みたいと思います。
# -- coding utf-8 --
import pydicom
import fileselect as fs

filenames = fs.folder_fileselect()
まずは、fileselectのモジュールを用いてフォルダ内の画像パスをfilenamesの変数に取り込みます。
そして、その変数をClassに渡し画像のピクセルデータを配列に取り込みます。
以前の記事から、Classの部分のコードをコピーします。画像読み込みをクラスを使ってやってみたの記事はこちらの記事を参照ください。
クラスがよくわからない方はこちらを参照ください。
このクラスではnumpyを用いていますのでnumpyのインポートを忘れないようにしましょう。
# -- coding utf-8 --
import pydicom
import fileselect as fs
import numpy as np

class Pixarr:
    def __init__(self,filenames):
        dcm = pydicom.dcmread(filenames[0])

        self.row = dcm[0x0028,0x0010].value
        self.column = dcm[0x0028,0x0011].value
        self.ww = dcm[0x0028,0x1050].value
        self.wl = dcm[0x0028,0x1050].value

        self.pix_arr = np.zeros((len(filenames),self.row,self.column),
            dtype ='int16')

        if len(filenames) == 1:
            self.pix_arr = dcm.pixel_array
        else:
            for i in range(len(filenames)):
                dcm = pydicom.dcmread(filenames[i])
                img_no = dcm[0x0020,0x0013].value
                self.pix_arr[img_no-1] = dcm.pixel_array

filenames = fs.folder_fileselect()
f0 = Pixarr(filenames)

filenames = fs.folder_fileselect()
f1 = Pixarr(filenames)
読み込んだ画像パスをClassに渡すのですが、ひかれる画像をf0、ひく画像をf1と名前を付けてクラスに渡します。(上記コード28行目)
これで、ひかれる画像のピクセルデータを取り込むことができました。
同様に、引く画像をf1として取り込みます。f0の時と同様にコードを書きます。(上記コード30~31行目)
これで、画像の読み込みは完了です。
画像間演算したデータを格納する配列を作成する
画像間演算のコードを書く前に、計算結果を格納する配列を作成します。
引く画像、引かれる画像と同一サイズの配列を作成します。f0,f1どちらでも構わないのですが同じ大きさの配列f2を作成します。その際に、0で初期化しておきます。
同一サイズの配列を作成するコードは
f2 = numpy.full_like(f0.pix_arr,0)
で作成できます。numpyはインポートする際npの名称でインポートしていますので、実際のコードは下記コード33行目の様にnp.full_likeの形になります。
# -- coding utf-8 --
import pydicom
import fileselect as fs
import numpy as np

class Pixarr:
    def __init__(self,filenames):
        dcm = pydicom.dcmread(filenames[0])

        self.row = dcm[0x0028,0x0010].value
        self.column = dcm[0x0028,0x0011].value
        self.ww = dcm[0x0028,0x1050].value
        self.wl = dcm[0x0028,0x1050].value

        self.pix_arr = np.zeros((len(filenames),self.row,self.column),
            dtype ='int16')

        if len(filenames) == 1:
            self.pix_arr = dcm.pixel_array
        else:
            for i in range(len(filenames)):
                dcm = pydicom.dcmread(filenames[i])
                img_no = dcm[0x0020,0x0013].value
                self.pix_arr[img_no-1] = dcm.pixel_array

filenames = fs.folder_fileselect()
f0 = Pixarr(filenames)

filenames = fs.folder_fileselect()
f1 = Pixarr(filenames)

f2 = np.full_like(f0.pix_arr,0)
画像間演算、サブトラクションのコード
サブトラクションはピクセル同士の引き算ですので本来であれば
f2[i] = f0.pix_arr[i] – f1.pix_arr[i]
のコードをfou文で繰り返すと考えるかもしれませんが、実はpythonでの配列計算はとても簡単で
f2 = f0.pix_arr – f1.pix_arr
の一文だけで済んでしまいます。もちろん、引き算だけでなく足し算でも使えますし、掛け算、割り算でも使用可能です。
for文でピクセルごとに計算しているよりも全然高速です。
ここまでのコードは以下となります。
# -- coding utf-8 --
import pydicom
import fileselect as fs
import numpy as np

class Pixarr:
    def __init__(self,filenames):
        dcm = pydicom.dcmread(filenames[0])

        self.row = dcm[0x0028,0x0010].value
        self.column = dcm[0x0028,0x0011].value
        self.ww = dcm[0x0028,0x1050].value
        self.wl = dcm[0x0028,0x1050].value

        self.pix_arr = np.zeros((len(filenames),self.row,self.column),
            dtype ='int16')

        if len(filenames) == 1:
            self.pix_arr = dcm.pixel_array
        else:
            for i in range(len(filenames)):
                dcm = pydicom.dcmread(filenames[i])
                img_no = dcm[0x0020,0x0013].value
                self.pix_arr[img_no-1] = dcm.pixel_array

filenames = fs.folder_fileselect()
f0 = Pixarr(filenames)

filenames = fs.folder_fileselect()
f1 = Pixarr(filenames)

f2 = np.full_like(f0.pix_arr,0)

f2 = f0.pix_arr - f1.pix_arr
画像表示のコード
画像表示はmatplotlibを使用したいと思いますので、まずはmatplotlibをインポートします。
# -- coding utf-8 --
import pydicom
import fileselect as fs
import numpy as np
import matplotlib.pyplot as plt

class Pixarr:
    def __init__(self,filenames):
        dcm = pydicom.dcmread(filenames[0])

        self.row = dcm[0x0028,0x0010].value
        self.column = dcm[0x0028,0x0011].value
        self.ww = dcm[0x0028,0x1050].value
        self.wl = dcm[0x0028,0x1050].value

        self.pix_arr = np.zeros((len(filenames),self.row,self.column),
            dtype ='int16')

        if len(filenames) == 1:
            self.pix_arr = dcm.pixel_array
        else:
            for i in range(len(filenames)):
                dcm = pydicom.dcmread(filenames[i])
                img_no = dcm[0x0020,0x0013].value
                self.pix_arr[img_no-1] = dcm.pixel_array

filenames = fs.folder_fileselect()
f0 = Pixarr(filenames)

filenames = fs.folder_fileselect()
f1 = Pixarr(filenames)

f2 = np.full_like(f0.pix_arr,0)

f2 = f0.pix_arr - f1.pix_arr
画像表示は引かれる画像、引く画像、計算後の画像の3画像表示したいと思います。
まずは、画像を表示設定からです。matplotlibで画像や、グラフ等を表示する際にまずはfigの設定をし、その後にaxの設定をします。ここが、よくわからないところかもしれませんが、考え方としては何もないところで絵を描こうとするときにまずは、画板や机を準備すると思います。それがfigにあたります。その後、その上に絵を描く紙を準備すると思います。それがaxにあたると考えやすいと思います。
figの設定は
fig = plt.figure()
チュートリアルはこちら
axの設定は
ax = fig.add_subplot()
で設定していきます。チュートリアルはこちら。
figの大きさの設定をします。引数の中にfigsize =(横、縦)で設定をします。
fig = plt.figure(figsize=(15, 5))
どこに画像を表示するかはaxの括弧の中に引数として指定します。
ax0 = fig.add_subplot(1,3,1) #一番左に表示
ax1 = fig.add_subplot(1,3,2) #真ん中に表示
ax2 = fig.add_subplot(1,3,3) #一番右に表示
括弧内の初めの引数は縦方向の画像数を、2個目の引数は横方向の画像数、3個目の引数を何番目に画像を表示するかという設定になります。
続いて、axにどの画像を表示するかの設定に入ります。
引かれる画像をax0に、引く画像をax1に、演算後の画像をax2として設定していきます。
ax0.imshow(f0.pix_arr[sl],cmap= 'bone')
ax1.imshow(f1.pix_arr[sl],cmap= 'bone')
ax2.imshow(f2[sl],cmap= 'bone')
これで、画像表示の設定は完了です。
# -- coding utf-8 --
import fileselect as fs
import pydicom
import numpy as np
import matplotlib.pyplot as plt

class Pixarr:
    def __init__(self,filenames):
        dcm = pydicom.dcmread(filenames[0])

        self.row = dcm[0x0028,0x0010].value
        self.column = dcm[0x0028,0x0011].value
        self.ww = dcm[0x0028,0x1050].value
        self.wl = dcm[0x0028,0x1050].value

        self.pix_arr = np.zeros((len(filenames),self.row,self.column),
            dtype ='int16')

        if len(filenames) == 1:
            self.pix_arr = dcm.pixel_array
        else:
            for i in range(len(filenames)):
                dcm = pydicom.dcmread(filenames[i])
                img_no = dcm[0x0020,0x0013].value
                self.pix_arr[img_no-1] = dcm.pixel_array

filenames = fs.folder_fileselect()
f0 = Pixarr(filenames)

filenames = fs.folder_fileselect()
f1 = Pixarr(filenames)


f2 = np.full_like(f0.pix_arr,0)

f2 = f0.pix_arr - f1.pix_arr

fig = plt.figure(figsize=(15, 5))
plt.subplots_adjust(left=0, right=1, bottom=0, top=1, wspace=0.05, hspace=0.05)
ax0 = fig.add_subplot(1,3,1)
ax1 = fig.add_subplot(1,3,2)
ax2 = fig.add_subplot(1,3,3)

ax0.imshow(f0.pix_arr[sl],cmap= 'bone')
ax1.imshow(f1.pix_arr[sl],cmap= 'bone')
ax2.imshow(f2[sl],cmap= 'bone')
axに画像の設定をした際に [sl] とありますが、これは、何枚目の画像を表示するかの変数になります。マウスホイールを回すことで画像を切り替えるための変数です。(上記コードの38行目 sl = 0 とコードを追加してください。)
その機能を実装していきます。
これは、マウスイベントと言って右クリックや、左クリック、マウスホイールを回す、または押す等のイベントで何をするか決められます。
マウスホイールのイベントは
fig.canvas.mpl_connect('scroll_event', wheel_scroll)
動作設定はdefで関数を作成して決めます。今回はwheel_scrollという名前で設定しますが、次回matplotlibのマウスイベントで詳しく説明したいと思いますので今回はコードの提示だけとします。
# -- coding utf-8 --
import fileselect as fs
import pydicom
import numpy as np
import matplotlib.pyplot as plt

class Pixarr:
    def __init__(self,filenames):
        dcm = pydicom.dcmread(filenames[0])

        self.row = dcm[0x0028,0x0010].value
        self.column = dcm[0x0028,0x0011].value
        self.ww = dcm[0x0028,0x1050].value
        self.wl = dcm[0x0028,0x1050].value

        self.pix_arr = np.zeros((len(filenames),self.row,self.column),
            dtype ='int16')

        if len(filenames) == 1:
            self.pix_arr = dcm.pixel_array
        else:
            for i in range(len(filenames)):
                dcm = pydicom.dcmread(filenames[i])
                img_no = dcm[0x0020,0x0013].value
                self.pix_arr[img_no-1] = dcm.pixel_array

def wheel_scroll(event):
    global sl

    if event.button == 'down':
        sl += 1
        if sl > len(filenames)-1:
            sl =0

    if event.button == 'up':
        sl -= 1
        if sl < 0:
            sl = len(filenames)-1

    ax0.imshow(f0.pix_arr[sl], cmap='bone')
    ax1.imshow(f1.pix_arr[sl], cmap='bone')
    ax2.imshow(f2[sl], cmap='bone')

    fig.canvas.draw()

filenames = fs.folder_fileselect()
f0 = Pixarr(filenames)

filenames = fs.folder_fileselect()
f1 = Pixarr(filenames)

f2 = np.full_like(f0.pix_arr,0)

f2 = f0.pix_arr - f1.pix_arr

sl =0

fig = plt.figure(figsize=(15, 5))
plt.subplots_adjust(left=0, right=1, bottom=0, top=1, wspace=0.05, hspace=0.05)
ax0 = fig.add_subplot(1,3,1)
ax1 = fig.add_subplot(1,3,2)
ax2 = fig.add_subplot(1,3,3)

ax0.imshow(f0.pix_arr[sl],cmap= 'bone')
ax1.imshow(f1.pix_arr[sl],cmap= 'bone')
ax2.imshow(f2[sl],cmap= 'bone')

fig.canvas.mpl_connect('scroll_event', wheel_scroll)

plt.show()
最後に
いかがでしたか?お持ちのDICOM画像でサブトラクションできましたでしょうか?

上記コードで実行した結果です。マンモのMRI Dynamic画像、一番左が単純、真ん中が動脈相、一番左がサブトラクション画像となります。
正常乳腺は引き算され、腫瘍は濃染されているのが確認できると思います。
皆さんも試してみてください。
お疲れ様でした。
The post 画像間演算、サブトラクションをやってみる。 first appeared on 診療放射線技師がPythonをはじめました。.]]>