はじめに
今回は、画像のヒストグラムを求めてみたいと思います。
ヒストグラムを使用する場面としては、グラフで視覚的に信号値の分布を見たい時と、信号値の分布を数値として知りたい時があると思います。
そこで、今回はグラフとして求める方法と、数値として得る方法2つを紹介したいと思います。
求める手段としては以下の2つをやっていきます。
- matplotlibでグラフ表示
- numpyで求める
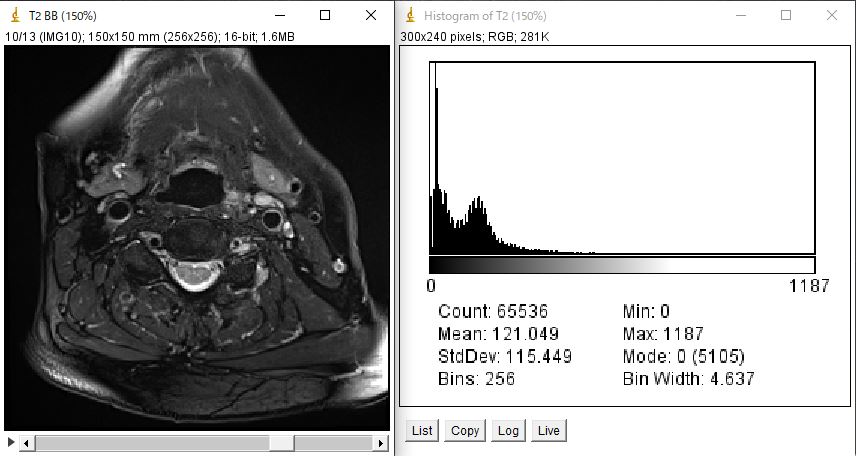
それでは、下の左側の画像を用いてそれぞれ紹介していきたいと思います。
ちなみに、右側は左側の画像のヒストグラムをimage-Jで表示したものです。
matplotlibでグラフ表示
まずはmatplotlibを用いて表示する方法を紹介します。
使用するライブラリーはmatplotlibのpyplotとなります。
それでは、コードを表示したいと思います。
# -- coding utf-8 --

import pydicom
import matplotlib.pyplot as plt
import numpy as np
import fileselect as fs

filename = fs.single_fileselect()
dcm = pydicom.dcmread(filename)

plt.hist(dcm.pixel_array)
plt.show()
ライブラリーのfileselectのコードはこちらを参照ください
上記コードで、ヒストグラムを求めるコードは12行目のplt.hist()となります。
カッコ内に第1引数としてピクセルデータの配列を指定します。
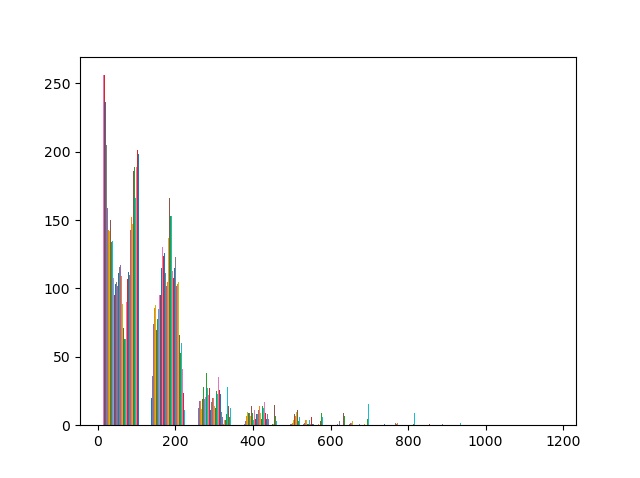
何か変だと思いませんか?ところどころ途切れているように見えます。階級であるbinの設定をしてみたいと思います。image-Jのヒストグラムと同一の設定にしてみましょう。image-Jではbinが256で設定されていますので上記コード12行目を以下に変更します。
# -- coding utf-8 --

import pydicom
import matplotlib.pyplot as plt
import numpy as np
import fileselect as fs

filename = fs.single_fileselect()
dcm = pydicom.dcmread(filename)

plt.hist(dcm.pixel_array,bins = 256)
plt.show()
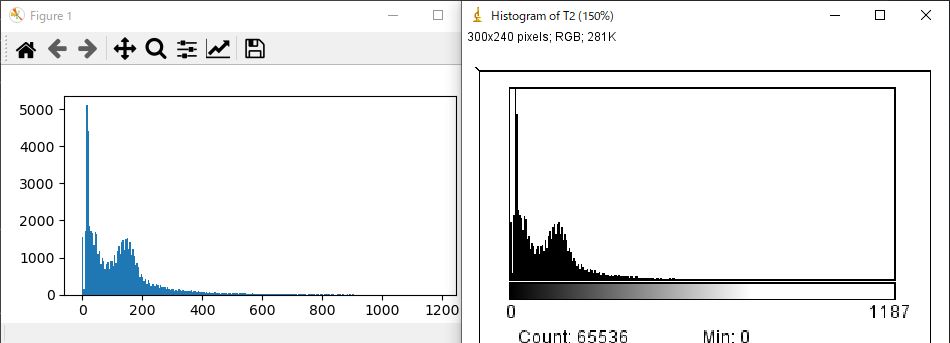
いかがでしょうか?同様の結果となりましたね。
その他、グラフの色を変えたり、グラフのタイプを変えてみたりと様々な設定はカッコ内に記載していきます。詳しくは以下のチュートリアルを参照してください。
matplotlib ヒストグラムのチュートリアルはこちら
追伸
ヒストグラムを求める際、多次元配列の場合に行を1つのデータと認識してしまい思い通りのヒストグラムが得られない場合があります。その場合は、1次元配列に変換して求めると思い通りのヒストグラムを求めることができる場合があります。
numpyで求める
早速、コードから入ってみたいと思います。
# -- coding utf-8 --

import pydicom
import numpy as np
import fileselect as fs

filename = fs.single_fileselect()
dcm = pydicom.dcmread(filename)

hist_np = np.histogram(dcm.pixel_array.ravel())

print(hist_np)
上記コードでヒストグラムを求めるコードは11行目のmp.histogram()となります。matplotlibの時と同様にカッコ内に引数にピクセルデータの配列を指定します。
しかし、注意していただきたいところがあります。
numpyでヒストグラムを求める場合、配列は1次元配列でなければならないということです。なので、11行目で多次元配列を1次元配列にするravel()を用いてdcm.pixel_arrayを1次元配列に変更しています。
それでは、コードを実行してみましょう。結果は以下となりました。
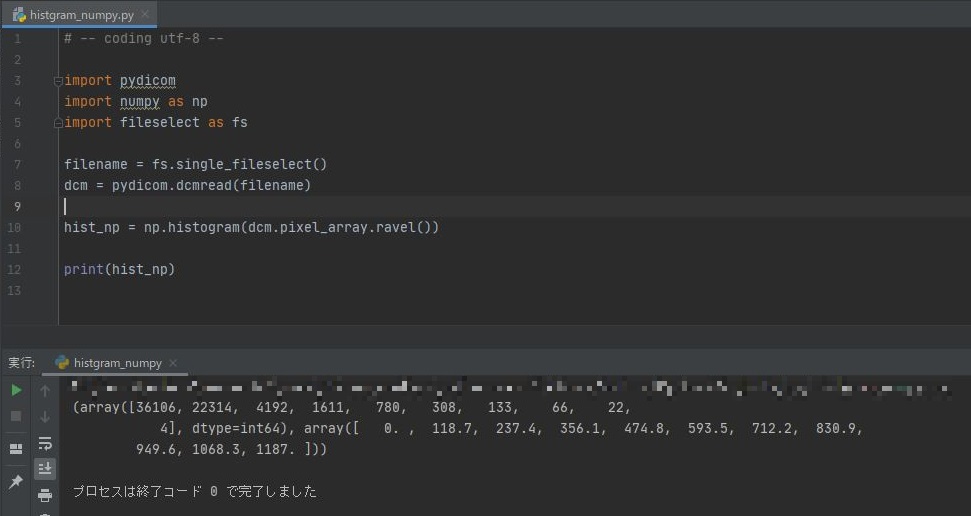
結果は
[36106,22314,4192,1611,780,300,133,66,22,4]
[0,110.7,237.4,356.1,474.8,593.5,712.2,830.9,949.6,1060.3,1187]
という2つの配列が返ってくる結果となりました。1つ目の配列の要素数は10個、2つ目の配列の要素は11個となっています。
それぞれの配列は何を示しているのでしょうか?それは、1つ目は度数を示しており、2つ目の配列は階級の幅であるbinの幅を示しています。
なので、2つ目の配列は0~118.7、118.8~237.4と言うようにその範囲を示しています。よって10個の範囲があることが分かります。
これを、先ほどと同じように階級binの設定をして再度表示させてみましょう。
# -- coding utf-8 --

import pydicom
import numpy as np
import fileselect as fs

filename = fs.single_fileselect()
dcm = pydicom.dcmread(filename)

hist_np = np.histogram(dcm.pixel_array.ravel(),bins=256)

print(hist_np)
matoplotlibの時と同様にヒストグラムを求めるコード(11行目)の引数にbins=256と足してあげます。結果はどうだったでしょうか?
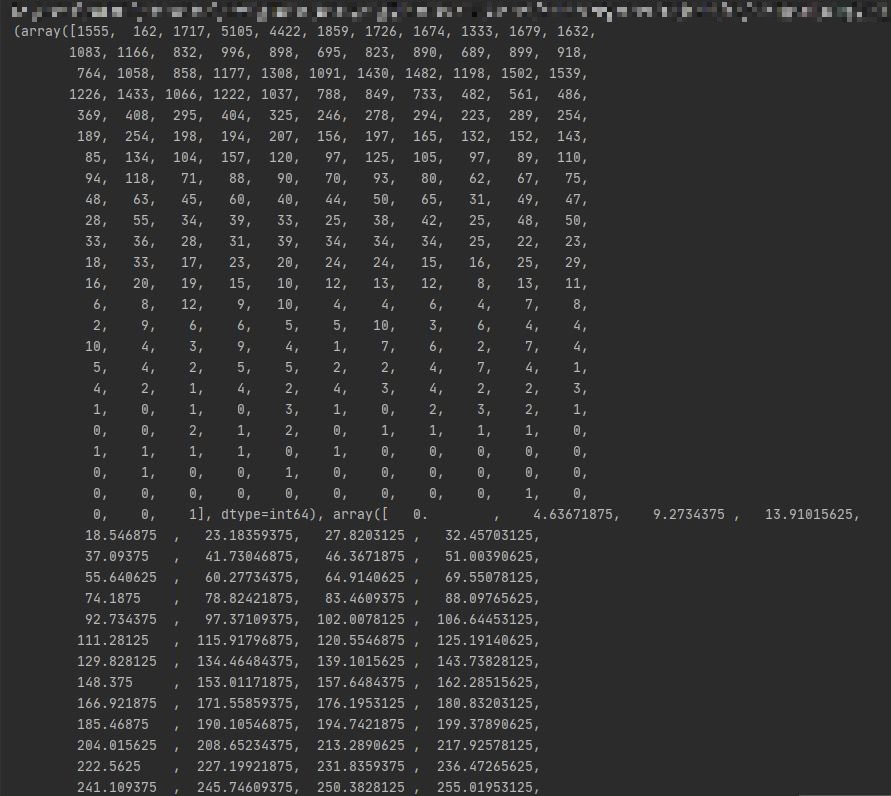
先ほどよりも、要素数が増えているのが分かります。はじめにimage-Jで求めたヒストグラムをリストとして出力したものが下の図のようになります。

いかがでしょうか?階級の幅、度数共に同様の結果となっています。
numpyにおいても様々な引数が用意されています。こちらのチュートリアルを参照してください。
最後に
いかがでしたか?今回はヒストグラムを求めるをやってみました。ヒストグラムは、画像にフィルタをかけたり、再構成をしたりした時に元画像との比較にする際に非常に役に立ちますね。是非ともマスターしておきたい技術ですね。
お疲れ様でした。
環境
- windows10
- python3.6.1
- Anaconda custom(64-bit)
- PyCharm2020.2(Communication Edition)