はじめに
今回の記事は前回の記事の続きになっております。
まだご覧になっていない方はこちらからどうぞ。
前回のコードは以下になります。
# -- coding utf-8 --

import tkinter
from tkinter import ttk

def matplot_show():
    pass


# メインウィンドウ
main_win = tkinter.Tk()
main_win.title("matplotlib 領域")
main_win.geometry("230x210")

# メインフレーム
main_frm = ttk.Frame(main_win)
main_frm.grid(column=0, row=0, sticky=tkinter.NSEW)

#ラベルの作成
fig_label = ttk.Label(main_frm, text="figsize",width =10)
ax_label = ttk.Label(main_frm, text="axの数",width =10)
ax_area_row = ttk.Label(main_frm, text="余白設定",width =10)
ax_space = ttk.Label(main_frm, text="画像間隔",width =10)

#Entryの作成
fig_row,fig_col = ttk.Entry(main_frm,width =5,justify="center"),ttk.Entry(main_frm,width =5,justify="center")
ax_box_row,ax_box_col = ttk.Entry(main_frm,width =5,justify="center"),ttk.Entry(main_frm,width =5,justify="center")
ax_area_l,ax_area_r = ttk.Entry(main_frm,width =5,justify="center"),ttk.Entry(main_frm,width =5,justify="center")
ax_area_u,ax_area_d = ttk.Entry(main_frm,width =5,justify="center"),ttk.Entry(main_frm,width =5,justify="center")
ax_space_hspace,ax_space_wspace = ttk.Entry(main_frm,width =5,justify="center"), ttk.Entry(main_frm,width =5,justify="center")

#ボタンの作成
app_btn = ttk.Button(main_frm, text="実行",command = matplot_show)

fig_label.grid(row=1, column=0)
fig_row.grid(row=1, column=1)
fig_col.grid(row=1, column=2,columnspan=2)

ax_label.grid(row=2, column=0)
ax_box_row.grid(row=2, column=1)
ax_box_col.grid(row=2, column=2,columnspan=2)

ax_area_u.grid(row=3,column=2)

ax_area_row.grid(row=4,column=0)
ax_area_l.grid(row=4,column=1)
ax_area_r.grid(row=4,column=3)

ax_area_d.grid(row=5,column=2)

ax_space.grid(row=6,column=0)
ax_space_hspace.grid(row=6,column=1)
ax_space_wspace.grid(row=6,column=2,columnspan=2)

app_btn.grid(row=7, column=0,columnspan=4)

fig_row.insert(0,"4"),fig_col.insert(0,"5")
ax_box_row.insert(0,"2"),ax_box_col.insert(0,"2")
ax_area_l.insert(0,"0"),ax_area_r.insert(0,"1")
ax_area_u.insert(0,"1"),ax_area_d.insert(0,"0")
ax_space_hspace.insert(0,"0.1"),ax_space_wspace.insert(0,"0.1")

main_win.mainloop()
tkinter Entryの値を取得する方法
前回の記事でEntryウイジェットを用いて値を入力できるようにしましたが、その値を取得する方法を紹介したいと思います。
これからのコードはmatplot_showの関数部分になりますので
passの文字を消してその部分に入力していきます。
忘れないうちにmatplotのインポートを忘れずに
import matplotlib.pyplot as plt
取得する方法は .get() を用い
変数名 = Entryウイジェット名.get()
で取得可能になります。
    fig__row = int(fig_row.get())
    fig_column = int(fig_col.get())
    ax_row = int(ax_box_row.get())
    ax_col = int(ax_box_col.get())
    ax_area_le = float(ax_area_l.get())
    ax_area_ri = float(ax_area_r.get())
    ax_area_up = float(ax_area_u.get())
    ax_area_do = float(ax_area_d.get())
    ax_space_h = float(ax_space_hspace.get())
    ax_space_w = float(ax_space_wspace.get())
ちなみに、初めの fig__row はタイプミスではありません。Entryウイジェットと同じ変数名は指定できない為、わざとアンダーバーを2つ重ねています。
Entryの数値は整数型、浮動小数点型の指定をして受けることにします。matplotlibのfig,axesの設定の際にエラーになるのを避けるために指定します。
matplotlibのfig,axesの設定
それでは、matplotlibの設定に入っていきます。
fig,axes = plt.subplots(縦の画像数,縦の画像数,figsize=(縦のサイズ, 横のサイズ))
ですのでそれぞれにEntryウイジェットから取得した変数名を入れていきます。
fig, axes = plt.subplots(ax__row, ax_col, figsize=(fig__row, fig_column)) 画像配置の設定に入る前に一つ準備をします。
画像の配置は縦方向に何番目、横方向に何番目と数字で指定しますので、その為1から縦方向の画像配置数の配列を作成します。横方向にも同様に作成します。私はnumpyが使いやすいのでnumpyをインポートして作成したいと思います。
ax_row_n = np.arange(0, ax_row) + 1
ax_col_n = np.arange(0, ax_col) + 1
それぞれの配列に1を足しているのは、配列の初めは0となってしまいますので配列作成後にそれぞれの要素に1を足してあげています。
続いて、画像配置の番号です。

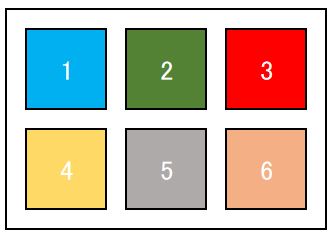
画像番号は図のように1から順番に設定していきますので、一つposという変数を1で設定しておきます。
それでは、画像の配置設定に入ります。for文で一つ一つ設定していきます。
pos = 1

for i in range(len(ax_row_n)):
    for j in range(len(ax_col_n)):
        axes[i][j] = fig.add_subplot(ax_row, ax_col, pos)
        pos += 1
これで、配置設定まで終わりました。
最後に画像表示のコード
plt.show()
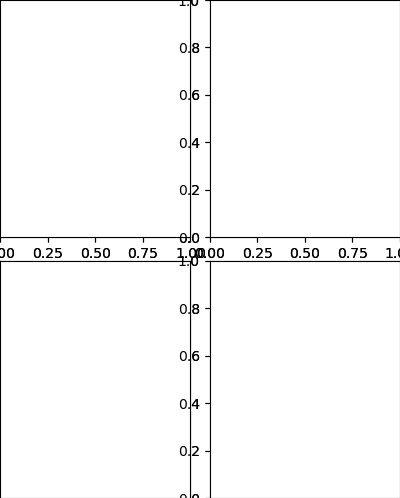
を入力して動かしてみましょう。

上記の様な画面が出ましたか?
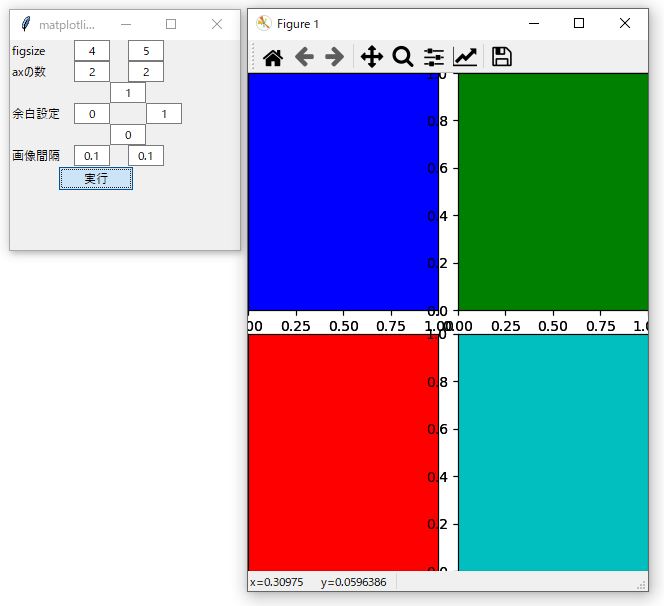
ちょっと味気ないので色を付けてみたいと思います。色のリストを作成します。
ちなみに、表示画像数が多くなると、このリストの要素数を超えてしまいエラーになるので多めに作成しておきましょう。このリストは8色を巡回しているだけです。
color_mp =['b', 'g', 'r', 'c', 'm', 'y', 'k', 'w','b', 'g', 'r', 'c', 'm', 'y', 'k', 'w','b', 'g', 'r', 'c', 'm', 'y', 'k', 'w','b', 'g', 'r', 'c', 'm', 'y', 'k', 'w','b', 'g', 'r', 'c', 'm', 'y', 'k', 'w','b', 'g', 'r', 'c', 'm', 'y', 'k', 'w']
関数を宣言している真下にでも追加しておいてください。
続いて、色を付ける設定です。
先ほどのfor文の中で配置設定をした下に
axes[i][j].set_facecolor(color_mp[pos-1])
を記入して完成です。


完成したコードは以下になります。
# -- coding utf-8 --

import tkinter
from tkinter import ttk
import matplotlib.pyplot as plt
import numpy as np

def matplot_show():
    color_mp =['b', 'g', 'r', 'c', 'm', 'y', 'k', 'w','b', 'g', 'r', 'c', 'm', 'y', 'k', 'w','b', 'g', 'r', 'c', 'm', 'y', 'k', 'w','b', 'g', 'r', 'c', 'm', 'y', 'k', 'w','b', 'g', 'r', 'c', 'm', 'y', 'k', 'w','b', 'g', 'r', 'c', 'm', 'y', 'k', 'w']

    fig__row = int(fig_row.get())
    fig_column = int(fig_col.get())
    ax_row = int(ax_box_row.get())
    ax_col = int(ax_box_col.get())
    ax_area_le = float(ax_area_l.get())
    ax_area_ri = float(ax_area_r.get())
    ax_area_up = float(ax_area_u.get())
    ax_area_do = float(ax_area_d.get())
    ax_space_h = float(ax_space_hspace.get())
    ax_space_w = float(ax_space_wspace.get())

    fig, axes = plt.subplots(ax_row, ax_col, figsize=(fig__row, fig_column))

    ax_row_n = np.arange(0, ax_row) + 1
    ax_col_n = np.arange(0, ax_col) + 1

    plt.subplots_adjust(left=ax_area_le, right=ax_area_ri, bottom=ax_area_do, top=ax_area_up, wspace=ax_space_h, hspace=ax_space_w)

    pos = 1

    for i in range(len(ax_row_n)):
        for j in range(len(ax_col_n)):
            axes[i][j] = fig.add_subplot(ax_row, ax_col, pos)
            axes[i][j].set_facecolor(color_mp[pos-1])
            pos += 1

    fig.canvas.draw()
    plt.show()


# メインウィンドウ
main_win = tkinter.Tk()
main_win.title("matplotlib 領域")
main_win.geometry("230x210")

# メインフレーム
main_frm = ttk.Frame(main_win)
main_frm.grid(column=0, row=0, sticky=tkinter.NSEW)

#ラベルの作成
fig_label = ttk.Label(main_frm, text="figsize",width =10)
ax_label = ttk.Label(main_frm, text="axの数",width =10)
ax_area_row = ttk.Label(main_frm, text="余白設定",width =10)
ax_space = ttk.Label(main_frm, text="画像間隔",width =10)

#Entryの作成
fig_row,fig_col = ttk.Entry(main_frm,width =5,justify="center"),ttk.Entry(main_frm,width =5,justify="center")
ax_box_row,ax_box_col = ttk.Entry(main_frm,width =5,justify="center"),ttk.Entry(main_frm,width =5,justify="center")
ax_area_l,ax_area_r = ttk.Entry(main_frm,width =5,justify="center"),ttk.Entry(main_frm,width =5,justify="center")
ax_area_u,ax_area_d = ttk.Entry(main_frm,width =5,justify="center"),ttk.Entry(main_frm,width =5,justify="center")
ax_space_hspace,ax_space_wspace = ttk.Entry(main_frm,width =5,justify="center"), ttk.Entry(main_frm,width =5,justify="center")

#ボタンの作成
app_btn = ttk.Button(main_frm, text="実行",command = matplot_show)

fig_label.grid(row=1, column=0)
fig_row.grid(row=1, column=1)
fig_col.grid(row=1, column=2,columnspan=2)

ax_label.grid(row=2, column=0)
ax_box_row.grid(row=2, column=1)
ax_box_col.grid(row=2, column=2,columnspan=2)

ax_area_u.grid(row=3,column=2)

ax_area_row.grid(row=4,column=0)
ax_area_l.grid(row=4,column=1)
ax_area_r.grid(row=4,column=3)

ax_area_d.grid(row=5,column=2)

ax_space.grid(row=6,column=0)
ax_space_hspace.grid(row=6,column=1)
ax_space_wspace.grid(row=6,column=2,columnspan=2)

app_btn.grid(row=7, column=0,columnspan=4)

fig_row.insert(0,"4"),fig_col.insert(0,"5")
ax_box_row.insert(0,"2"),ax_box_col.insert(0,"2")
ax_area_l.insert(0,"0"),ax_area_r.insert(0,"1")
ax_area_u.insert(0,"1"),ax_area_d.insert(0,"0")
ax_space_hspace.insert(0,"0.1"),ax_space_wspace.insert(0,"0.1")

main_win.mainloop()
最後に
シュミレーションできましたか?コードが不完全でFigureの閉じるボタンを押さないと変更を変えられませんが、ご勘弁を。
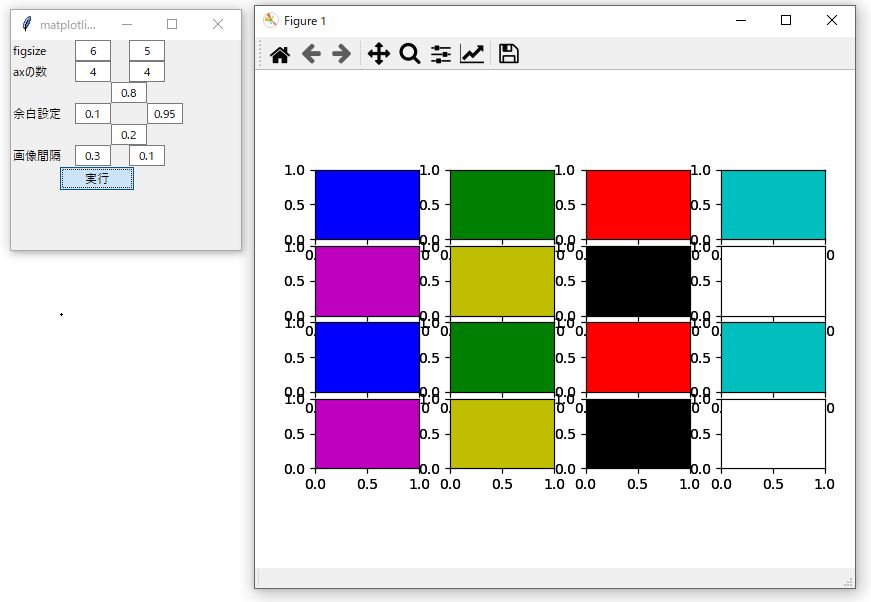
また、余白設定は最大値1です。左側より右側が、下より上の数値が大きくなってもエラーが出ます。
画像数がカラーリストの要素数を超えてもエラーができます。
お時間がある方はエラー処理を追加して完成を目指してください。
お疲れ様でした。
The post tkinterのGUIを使ってmatplotlibのfigやaxesの配置をシュミレーションできるプログラムを組んでみた② first appeared on 診療放射線技師がPythonをはじめました。.]]>