はじめに
こんにちは。でめきんです。
前々回、「tkinterでmatplotlibの画像を表示」という記事を書きましたが、今回は「openCVの画像を表示する」をやってみたいと思います。
openCVは画像処理や、動画を処理するライブラリーとなっていますので、tkinter上にopenCVで取り込んだ画像を表示できれば、tkinterのGUI機能であるボタン等に画像処理の機能を実装することが出来るようになります。
いわゆる、画像処理ソフト的なものを作成することが出来るかもしれません。
一見、openCVで取り込んだ画像をtkinterに表示ととらえられるかもしれませんが、実際はopenCVで取り込んだ画像をmatplotlibで表示。それをtkinter上に表示するという流れになります。
openCV自体にtkinterのGUI上に画像を表示させる機能は無いみたいです。ネット上ではopenCVで取り込んだ画像をPILLOWを用いてtkinter上に表示する記事が多いですが、我々診療放射線技師はmatplotlibを用いて表示した方が何かと便利だと思いますので今回はmatplotlibを用いた方法を紹介します。
流れ
前々回の記事での流れと同様となります。
- 画像をopenCVで読み込む
- matplotlibの表示設定を行う
- tkinterのcanvas設定を行う
注意点
今回注意しなければならない点が1点あります。
それは、openCVで取り込んだ画像はBlue,Green,RedのBGR順での色情報となっています。しかし、matplotlibやPILLOWではRed,Green,BlueのRGB順で色情報が入っていますので、その順番を変えてあげる必要があります。
ちなみに、入れ替えずに画像表示をすると以下の画像となります。
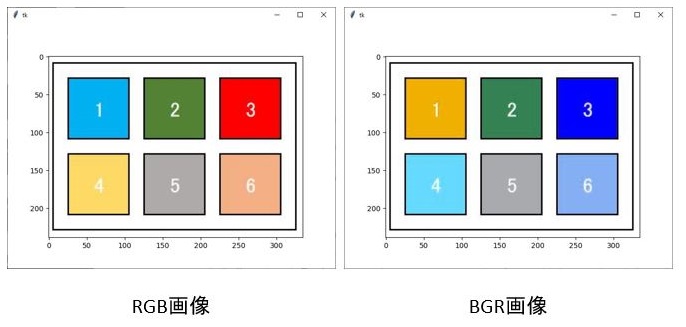
上の図を見てみると、「3」の背景色左のRGB画像では赤ですが、右のBGR画像では青に入れ替わっています。「1」と「4」の背景色も入れ替わっていますね。
それでは、どのように変更するかというと
img_rgb = cv2.cvtColor(img_bgr, cv2.COLOR_BGR2RGB)
cv2.cvtColorといったコードを用いて、BGRからRGBに変更することができます。
ちなみに、BGR2RGBの2はタイプミスではありませんのであしからず。toの意味です。ちなみにグレイスケールに変更する場合はBGR2GLAYでできます。
コード
完成コードは以下となります。
import tkinter
import cv2
import matplotlib.pyplot as plt
from matplotlib.backends.backend_tkagg import FigureCanvasTkAgg

root = tkinter.Tk()

img_bgr = cv2.imread("img.JPG")
img_rgb = cv2.cvtColor(img_bgr, cv2.COLOR_BGR2RGB) # BGRからRGBに変換

fig = plt.figure()
ax =fig.add_subplot()
ax = img_rgb

plt.imshow(img_rgb)

Canvas = FigureCanvasTkAgg(fig, master=root)
Canvas.get_tk_widget().grid(row=0, column=0)
root.mainloop()
最後に
いかがでしたか?
次回は、openCVの機能をtkinterのボタンウイジェットに組み込むという事をやってみたいと思います。
お疲れ様でした。
The post tkinterでopenCVの画像を表示 first appeared on 診療放射線技師がPythonをはじめました。.]]>はじめに
こんにちは、でめきんです。
今回は、tkinterを使ってmatplotlibの画像や、グラフを表示する方法を紹介したいと思います。
これを使うことでボタンや、エントリーボックスを設定することが出来、いわゆるソフト的な物を作成することが出来て非常に便利です。
それでは、やっていきましょう。
流れ
matplotlibで画像を表示する際には
① fig = plt.figure()
② ax = fig.add_subplot()
③ ax = ‘画像や配列’
④ plt.show()
で画像表示をしていくわけですが、tkinterを用いて画像表示する際には
④が変わってきます。
使うコード
使用するコードは
FigureCanvasTkAgg(fig, master=root)
となります。
Canvas = FigureCanvasTkAgg(fig, master=root)
引数部分は(matplotlibで設定したfig , tkinterで作成した領域)となります。
実際のコード
まずは、matplotlibで画像表示
import matplotlib.pyplot as plt
from matplotlib.image import imread

img = imread("img.JPG")

fig = plt.figure()
ax =fig.add_subplot()
ax = img

plt.imshow(img)
plt.show()
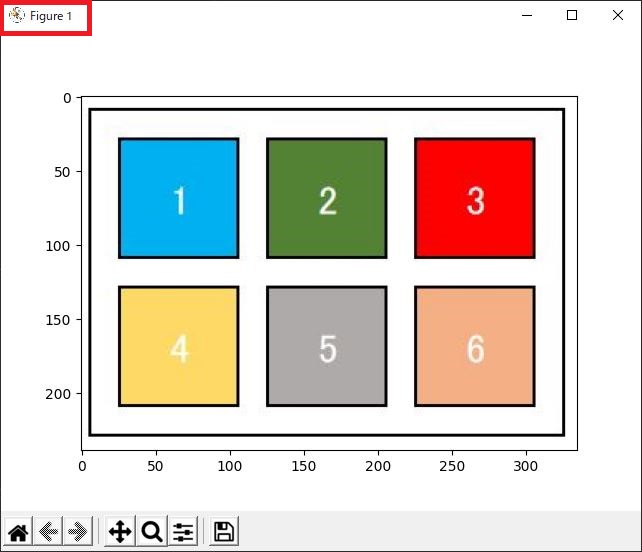
左上の部分を確認するとmatplotlibのマークが出ています。
続いて本題、tkinterを使ってmatplotlibの画像を表示してみたいと思います。
まず、必要なライブラリーのインポートします。
from matplotlib.backends.backend_tkagg import FigureCanvasTkAgg
がライブラリーのインポートとなります。
import tkinter
from matplotlib.backends.backend_tkagg import FigureCanvasTkAgg
tkinterとmatplotlibを紐づけるライブラリ
import matplotlib.pyplot as plt
from matplotlib.image import imread

img = imread("img.JPG")
fig = plt.figure()
ax =fig.add_subplot()
ax = img
plt.imshow(img)
#plt.show()

root = tkinter.Tk()
root.title("tkinterでmatplotの画像表示")
Canvas = FigureCanvasTkAgg(fig, master=root)
Canvas.get_tk_widget().grid(row=0, column=0)
root.mainloop()
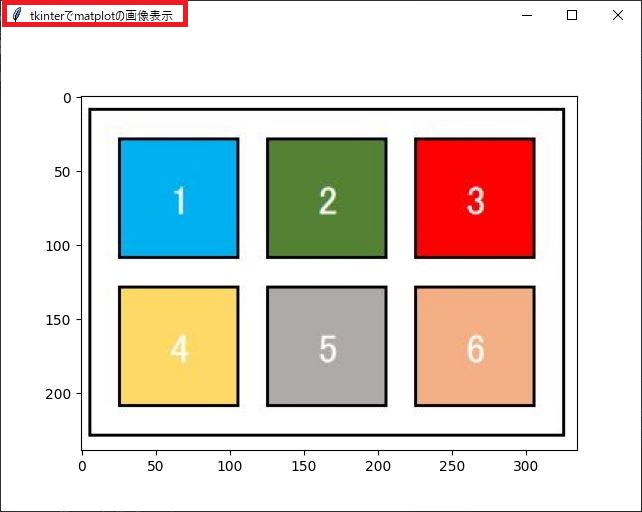
左上の羽のマークがtkinterという証拠になります。
最後に
いかがでしたか?
tkinterを用いることで、GUIの作成ができるようになります。
ボタン等いろんなものを設置して、アプリを作成することが出来るようになるとプログラミングがもっと楽しくなってきますよね。
是非とも試してください。
The post tkinterでmatplotlibの画像を表示 first appeared on 診療放射線技師がPythonをはじめました。.]]>はじめに
今回の記事は前回の記事の続きになっております。
まだご覧になっていない方はこちらからどうぞ。
前回のコードは以下になります。
# -- coding utf-8 --

import tkinter
from tkinter import ttk

def matplot_show():
    pass


# メインウィンドウ
main_win = tkinter.Tk()
main_win.title("matplotlib 領域")
main_win.geometry("230x210")

# メインフレーム
main_frm = ttk.Frame(main_win)
main_frm.grid(column=0, row=0, sticky=tkinter.NSEW)

#ラベルの作成
fig_label = ttk.Label(main_frm, text="figsize",width =10)
ax_label = ttk.Label(main_frm, text="axの数",width =10)
ax_area_row = ttk.Label(main_frm, text="余白設定",width =10)
ax_space = ttk.Label(main_frm, text="画像間隔",width =10)

#Entryの作成
fig_row,fig_col = ttk.Entry(main_frm,width =5,justify="center"),ttk.Entry(main_frm,width =5,justify="center")
ax_box_row,ax_box_col = ttk.Entry(main_frm,width =5,justify="center"),ttk.Entry(main_frm,width =5,justify="center")
ax_area_l,ax_area_r = ttk.Entry(main_frm,width =5,justify="center"),ttk.Entry(main_frm,width =5,justify="center")
ax_area_u,ax_area_d = ttk.Entry(main_frm,width =5,justify="center"),ttk.Entry(main_frm,width =5,justify="center")
ax_space_hspace,ax_space_wspace = ttk.Entry(main_frm,width =5,justify="center"), ttk.Entry(main_frm,width =5,justify="center")

#ボタンの作成
app_btn = ttk.Button(main_frm, text="実行",command = matplot_show)

fig_label.grid(row=1, column=0)
fig_row.grid(row=1, column=1)
fig_col.grid(row=1, column=2,columnspan=2)

ax_label.grid(row=2, column=0)
ax_box_row.grid(row=2, column=1)
ax_box_col.grid(row=2, column=2,columnspan=2)

ax_area_u.grid(row=3,column=2)

ax_area_row.grid(row=4,column=0)
ax_area_l.grid(row=4,column=1)
ax_area_r.grid(row=4,column=3)

ax_area_d.grid(row=5,column=2)

ax_space.grid(row=6,column=0)
ax_space_hspace.grid(row=6,column=1)
ax_space_wspace.grid(row=6,column=2,columnspan=2)

app_btn.grid(row=7, column=0,columnspan=4)

fig_row.insert(0,"4"),fig_col.insert(0,"5")
ax_box_row.insert(0,"2"),ax_box_col.insert(0,"2")
ax_area_l.insert(0,"0"),ax_area_r.insert(0,"1")
ax_area_u.insert(0,"1"),ax_area_d.insert(0,"0")
ax_space_hspace.insert(0,"0.1"),ax_space_wspace.insert(0,"0.1")

main_win.mainloop()
tkinter Entryの値を取得する方法
前回の記事でEntryウイジェットを用いて値を入力できるようにしましたが、その値を取得する方法を紹介したいと思います。
これからのコードはmatplot_showの関数部分になりますので
passの文字を消してその部分に入力していきます。
忘れないうちにmatplotのインポートを忘れずに
import matplotlib.pyplot as plt
取得する方法は .get() を用い
変数名 = Entryウイジェット名.get()
で取得可能になります。
    fig__row = int(fig_row.get())
    fig_column = int(fig_col.get())
    ax_row = int(ax_box_row.get())
    ax_col = int(ax_box_col.get())
    ax_area_le = float(ax_area_l.get())
    ax_area_ri = float(ax_area_r.get())
    ax_area_up = float(ax_area_u.get())
    ax_area_do = float(ax_area_d.get())
    ax_space_h = float(ax_space_hspace.get())
    ax_space_w = float(ax_space_wspace.get())
ちなみに、初めの fig__row はタイプミスではありません。Entryウイジェットと同じ変数名は指定できない為、わざとアンダーバーを2つ重ねています。
Entryの数値は整数型、浮動小数点型の指定をして受けることにします。matplotlibのfig,axesの設定の際にエラーになるのを避けるために指定します。
matplotlibのfig,axesの設定
それでは、matplotlibの設定に入っていきます。
fig,axes = plt.subplots(縦の画像数,縦の画像数,figsize=(縦のサイズ, 横のサイズ))
ですのでそれぞれにEntryウイジェットから取得した変数名を入れていきます。
fig, axes = plt.subplots(ax__row, ax_col, figsize=(fig__row, fig_column)) 画像配置の設定に入る前に一つ準備をします。
画像の配置は縦方向に何番目、横方向に何番目と数字で指定しますので、その為1から縦方向の画像配置数の配列を作成します。横方向にも同様に作成します。私はnumpyが使いやすいのでnumpyをインポートして作成したいと思います。
ax_row_n = np.arange(0, ax_row) + 1
ax_col_n = np.arange(0, ax_col) + 1
それぞれの配列に1を足しているのは、配列の初めは0となってしまいますので配列作成後にそれぞれの要素に1を足してあげています。
続いて、画像配置の番号です。
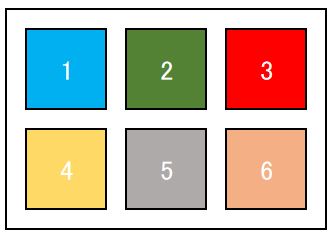
画像番号は図のように1から順番に設定していきますので、一つposという変数を1で設定しておきます。
それでは、画像の配置設定に入ります。for文で一つ一つ設定していきます。
pos = 1

for i in range(len(ax_row_n)):
    for j in range(len(ax_col_n)):
        axes[i][j] = fig.add_subplot(ax_row, ax_col, pos)
        pos += 1
これで、配置設定まで終わりました。
最後に画像表示のコード
plt.show()
を入力して動かしてみましょう。
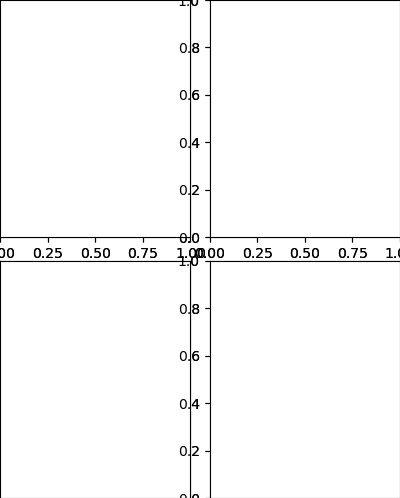
上記の様な画面が出ましたか?
ちょっと味気ないので色を付けてみたいと思います。色のリストを作成します。
ちなみに、表示画像数が多くなると、このリストの要素数を超えてしまいエラーになるので多めに作成しておきましょう。このリストは8色を巡回しているだけです。
color_mp =['b', 'g', 'r', 'c', 'm', 'y', 'k', 'w','b', 'g', 'r', 'c', 'm', 'y', 'k', 'w','b', 'g', 'r', 'c', 'm', 'y', 'k', 'w','b', 'g', 'r', 'c', 'm', 'y', 'k', 'w','b', 'g', 'r', 'c', 'm', 'y', 'k', 'w','b', 'g', 'r', 'c', 'm', 'y', 'k', 'w']
関数を宣言している真下にでも追加しておいてください。
続いて、色を付ける設定です。
先ほどのfor文の中で配置設定をした下に
axes[i][j].set_facecolor(color_mp[pos-1])
を記入して完成です。
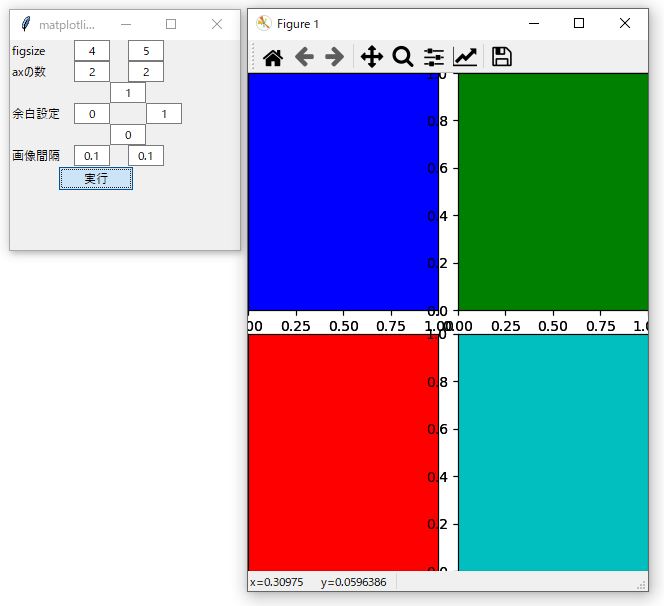
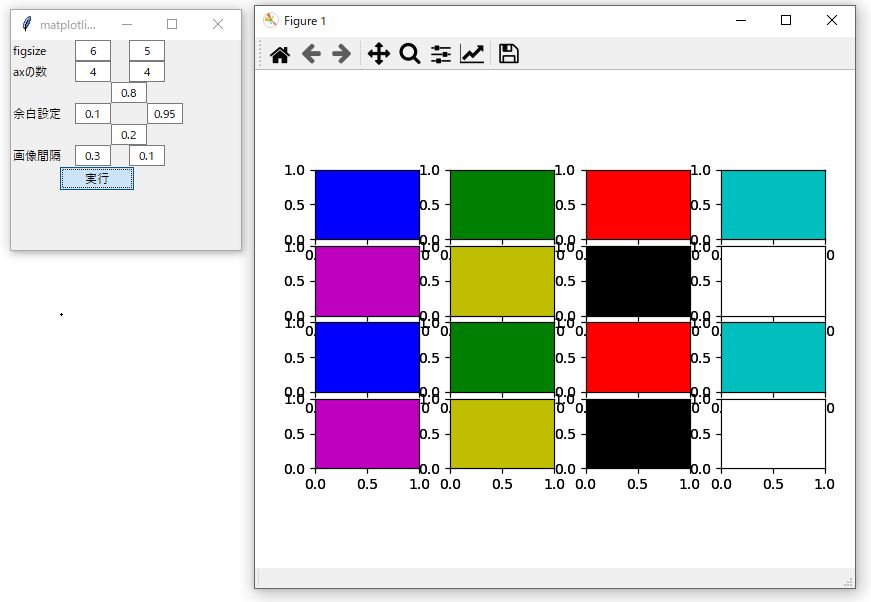
完成したコードは以下になります。
# -- coding utf-8 --

import tkinter
from tkinter import ttk
import matplotlib.pyplot as plt
import numpy as np

def matplot_show():
    color_mp =['b', 'g', 'r', 'c', 'm', 'y', 'k', 'w','b', 'g', 'r', 'c', 'm', 'y', 'k', 'w','b', 'g', 'r', 'c', 'm', 'y', 'k', 'w','b', 'g', 'r', 'c', 'm', 'y', 'k', 'w','b', 'g', 'r', 'c', 'm', 'y', 'k', 'w','b', 'g', 'r', 'c', 'm', 'y', 'k', 'w']

    fig__row = int(fig_row.get())
    fig_column = int(fig_col.get())
    ax_row = int(ax_box_row.get())
    ax_col = int(ax_box_col.get())
    ax_area_le = float(ax_area_l.get())
    ax_area_ri = float(ax_area_r.get())
    ax_area_up = float(ax_area_u.get())
    ax_area_do = float(ax_area_d.get())
    ax_space_h = float(ax_space_hspace.get())
    ax_space_w = float(ax_space_wspace.get())

    fig, axes = plt.subplots(ax_row, ax_col, figsize=(fig__row, fig_column))

    ax_row_n = np.arange(0, ax_row) + 1
    ax_col_n = np.arange(0, ax_col) + 1

    plt.subplots_adjust(left=ax_area_le, right=ax_area_ri, bottom=ax_area_do, top=ax_area_up, wspace=ax_space_h, hspace=ax_space_w)

    pos = 1

    for i in range(len(ax_row_n)):
        for j in range(len(ax_col_n)):
            axes[i][j] = fig.add_subplot(ax_row, ax_col, pos)
            axes[i][j].set_facecolor(color_mp[pos-1])
            pos += 1

    fig.canvas.draw()
    plt.show()


# メインウィンドウ
main_win = tkinter.Tk()
main_win.title("matplotlib 領域")
main_win.geometry("230x210")

# メインフレーム
main_frm = ttk.Frame(main_win)
main_frm.grid(column=0, row=0, sticky=tkinter.NSEW)

#ラベルの作成
fig_label = ttk.Label(main_frm, text="figsize",width =10)
ax_label = ttk.Label(main_frm, text="axの数",width =10)
ax_area_row = ttk.Label(main_frm, text="余白設定",width =10)
ax_space = ttk.Label(main_frm, text="画像間隔",width =10)

#Entryの作成
fig_row,fig_col = ttk.Entry(main_frm,width =5,justify="center"),ttk.Entry(main_frm,width =5,justify="center")
ax_box_row,ax_box_col = ttk.Entry(main_frm,width =5,justify="center"),ttk.Entry(main_frm,width =5,justify="center")
ax_area_l,ax_area_r = ttk.Entry(main_frm,width =5,justify="center"),ttk.Entry(main_frm,width =5,justify="center")
ax_area_u,ax_area_d = ttk.Entry(main_frm,width =5,justify="center"),ttk.Entry(main_frm,width =5,justify="center")
ax_space_hspace,ax_space_wspace = ttk.Entry(main_frm,width =5,justify="center"), ttk.Entry(main_frm,width =5,justify="center")

#ボタンの作成
app_btn = ttk.Button(main_frm, text="実行",command = matplot_show)

fig_label.grid(row=1, column=0)
fig_row.grid(row=1, column=1)
fig_col.grid(row=1, column=2,columnspan=2)

ax_label.grid(row=2, column=0)
ax_box_row.grid(row=2, column=1)
ax_box_col.grid(row=2, column=2,columnspan=2)

ax_area_u.grid(row=3,column=2)

ax_area_row.grid(row=4,column=0)
ax_area_l.grid(row=4,column=1)
ax_area_r.grid(row=4,column=3)

ax_area_d.grid(row=5,column=2)

ax_space.grid(row=6,column=0)
ax_space_hspace.grid(row=6,column=1)
ax_space_wspace.grid(row=6,column=2,columnspan=2)

app_btn.grid(row=7, column=0,columnspan=4)

fig_row.insert(0,"4"),fig_col.insert(0,"5")
ax_box_row.insert(0,"2"),ax_box_col.insert(0,"2")
ax_area_l.insert(0,"0"),ax_area_r.insert(0,"1")
ax_area_u.insert(0,"1"),ax_area_d.insert(0,"0")
ax_space_hspace.insert(0,"0.1"),ax_space_wspace.insert(0,"0.1")

main_win.mainloop()
最後に
シュミレーションできましたか?コードが不完全でFigureの閉じるボタンを押さないと変更を変えられませんが、ご勘弁を。
また、余白設定は最大値1です。左側より右側が、下より上の数値が大きくなってもエラーが出ます。
画像数がカラーリストの要素数を超えてもエラーができます。
お時間がある方はエラー処理を追加して完成を目指してください。
お疲れ様でした。
The post tkinterのGUIを使ってmatplotlibのfigやaxesの配置をシュミレーションできるプログラムを組んでみた② first appeared on 診療放射線技師がPythonをはじめました。.]]>はじめに
こんにちは、でめきんです。
matplotlibで1枚の画像を表示する時、その設定は特に困る事はないのですが複数枚のグラフや画像を表示する時にその設定をすることがとても苦手なんです。
そこで、今回figの大きさや、axesの配置設定をシュミレーションできるプログラムを組んでみました。入力フォームにtkinterのGUIを用いました。ただ、かなりやっつけ的な感じで組んだので出来はあまりよくありませんが興味のある方は一度お試しあれです。
条件を考える
まずは、条件を考えていきましょう。今回私が考えた条件は以下の4点です。
- figの大きさを変えられるようにしたい
- axesの数は変えられるようにしたい。
- fig上での余白を設定できるようにしたい
- 画像間隔を設定できるようにしたい
これらの条件を変更できるようにするにはpythonの標準ライブラリーのtkinterを用いてGUIを作成することにしました。
entrytウィジェット(数値を入力できる枠)は
- figの大きさ、axesの数の設定に2個づつで4個
- figの余白設定で上下左右なので4個
- 画像の間隔を指定するのに2個
全てで合計10個のentryウイジェットが必要になります。
その他に、実行ボタン。
それぞれのラベルfigsize,axesの数,余白設定,画像間隔のラベルを作成したいので
ラベル4つが必要になります。
※ウイジェットとは、パーツを指します。ラベルであったり、文字入力の欄であったり、ボタンであったりです。
tkinter、まずはウイジェットを配置するウインドウ作成
それでは、ウイジェットを配置するためのウインドウを作成しその後にメインフレームを作成しましょう。
初めてtkinterを使った時、この設定が全く分かりませんでした。はじめにメインウインドウを作成して、その後にフレームを作成してと・・・・同じような事を2回も繰り返して・・・・なぜ?
以前も記載しましたが、今回も同じ。考え方としては何が絵を描こうとするときに机、もしくは画板等の台を用意すると思います。それがメインウインドウ。ただ、その机や画板に直接絵を描くわけではなく、台の上に紙や、画用紙を置いて書くと思います。その紙に当たるのがメインフレームに当たります。
コードを書いていきます。まずは、tkinterをインポートするところから始めます。
# -- coding utf-8 --

import tkinter
from tkinter import ttk
そして、机に当たるメインウインドウを作ります。
# -- coding utf-8 --

import tkinter
from tkinter import ttk

# メインウィンドウ
main_win = tkinter.Tk()
main_win.title("matplotlib 領域")
main_win.geometry("230x210")
8行目ではウインドウ名(GUIの上に表示できる名前)の設定と、9行目でサイズの指定を行っています。
その後にフレームの作成になります。
# -- coding utf-8 --

import tkinter
from tkinter import ttk

main_win = tkinter.Tk()
main_win.title("matplotlib 領域")
main_win.geometry("230x210")

# メインウィンドウ
main_win = tkinter.Tk()
main_win.title("matplotlib 領域")
main_win.geometry("230x210")

# メインフレーム
main_frm = ttk.Frame(main_win)
17行目でメインフレームをメインウインドウの中に割り当てています。
tkinter、グリッドの設定とウイジェットの作成
tkinterの配置はgrid関数を使って当てはめていきます。
感じとしてはExcelを想像してもらうといいかもしれません。
グリッド設定
まずはメインフレームにグリッドを指定し、フレーム内のどこに設定するか決めます。
# -- coding utf-8 --

import tkinter
from tkinter import ttk

main_win = tkinter.Tk()
main_win.title("matplotlib 領域")
main_win.geometry("230x210")

# メインウィンドウ
main_win = tkinter.Tk()
main_win.title("matplotlib 領域")
main_win.geometry("230x210")

# メインフレーム
main_frm = ttk.Frame(main_win)
main_frm.grid(column=0, row=0, sticky=tkinter.NSEW)
18行目でNSEWとありますが、これは北南東西の意味になっています。
これで、メインフレームのグリッドの設定は終わりました。
ウイジェットの作成
ウイジェットはいろいろありますが、今回はLabel、Entry、Buttonを使います。
Labelの設定は
変数名 = ttk.Label(“配置するフレーム名”,”フレームに入れる文字列”,width = ラベルの幅,Justify = 配置設定)
で指定します。今回は
- figsize
- axの数
- 余白設定
- 画像間隔
の4つを作成します。それぞれ幅は10に設定します。
# -- coding utf-8 --

import tkinter
from tkinter import ttk

main_win = tkinter.Tk()
main_win.title("matplotlib 領域")
main_win.geometry("230x210")

# メインウィンドウ
main_win = tkinter.Tk()
main_win.title("matplotlib 領域")
main_win.geometry("230x210")

# メインフレーム
main_frm = ttk.Frame(main_win)
main_frm.grid(column=0, row=0, sticky=tkinter.NSEW)

#ラベルの作成
fig_label = ttk.Label(main_frm, text="figsize",width =10)
ax_label = ttk.Label(main_frm, text="axの数",width =10)
ax_area_row = ttk.Label(main_frm, text="余白設定",width =10)
ax_space = ttk.Label(main_frm, text="画像間隔",width =10)
justifyの設定はデフォルトが左寄せなので今回は省略しました。
続いてEntryの設定です。
変数名 = ttk.Entry(“配置するフレーム名”,width =Entryの幅,justify=配置設定)
で設定していきます。
今回作成するEntryは配置するフレーム、大きさや、配置設定は全て同じになりますので項目ごとに1行で書いていく事にします。
書き方の例としては変数aとbに1と9の数字を代入する場合を考えてみたいと思います。
a , b = 1 , 9
の様にすることでそれぞれに代入できます。
figの設定では、縦と横があります。変数名をそれぞれfig_row,fig_colとします。
fig_row , fig_col = ttk.Entry(main_frm) , ttk.Entry(main_frm)
で設定することが出来ます。簡素化のためにwithとjustifyの設定は省略しました。同様にaxの設定と余白、画像間隔のEntryを作成していきます。
# -- coding utf-8 --

import tkinter
from tkinter import ttk

main_win = tkinter.Tk()
main_win.title("matplotlib 領域")
main_win.geometry("230x210")

# メインウィンドウ
main_win = tkinter.Tk()
main_win.title("matplotlib 領域")
main_win.geometry("230x210")

# メインフレーム
main_frm = ttk.Frame(main_win)
main_frm.grid(column=0, row=0, sticky=tkinter.NSEW)

#ラベルの作成
fig_label = ttk.Label(main_frm, text="figsize",width =10)
ax_label = ttk.Label(main_frm, text="axの数",width =10)
ax_area_row = ttk.Label(main_frm, text="余白設定",width =10)
ax_space = ttk.Label(main_frm, text="画像間隔",width =10)

#Entryの作成
fig_row,fig_col = ttk.Entry(main_frm,width =5,justify="center"),ttk.Entry(main_frm,width =5,justify="center")
ax_box_row,ax_box_col = ttk.Entry(main_frm,width =5,justify="center"),ttk.Entry(main_frm,width =5,justify="center")
ax_area_l,ax_area_r = ttk.Entry(main_frm,width =5,justify="center"),ttk.Entry(main_frm,width =5,justify="center")
ax_area_u,ax_area_d = ttk.Entry(main_frm,width =5,justify="center"),ttk.Entry(main_frm,width =5,justify="center")
ax_space_hspace,ax_space_wspace = ttk.Entry(main_frm,width =5,justify="center"), ttk.Entry(main_frm,width =5,justify="center")
後は実行ボタンの作成です。
ボタンの設定は以下となります
変数名 = ttk.Button(“配置するフレーム名”, text=”文字列”,command = 実行する関数)
となります。今回、実行する関数は”matplot_show”とします。(後で作成します。)
# -- coding utf-8 --

import tkinter
from tkinter import ttk

main_win = tkinter.Tk()
main_win.title("matplotlib 領域")
main_win.geometry("230x210")

# メインウィンドウ
main_win = tkinter.Tk()
main_win.title("matplotlib 領域")
main_win.geometry("230x210")

# メインフレーム
main_frm = ttk.Frame(main_win)
main_frm.grid(column=0, row=0, sticky=tkinter.NSEW)

#ラベルの作成
fig_label = ttk.Label(main_frm, text="figsize",width =10)
ax_label = ttk.Label(main_frm, text="axの数",width =10)
ax_area_row = ttk.Label(main_frm, text="余白設定",width =10)
ax_space = ttk.Label(main_frm, text="画像間隔",width =10)

#Entryの作成
fig_row,fig_col = ttk.Entry(main_frm,width =5,justify="center"),ttk.Entry(main_frm,width =5,justify="center")
ax_box_row,ax_box_col = ttk.Entry(main_frm,width =5,justify="center"),ttk.Entry(main_frm,width =5,justify="center")
ax_area_l,ax_area_r = ttk.Entry(main_frm,width =5,justify="center"),ttk.Entry(main_frm,width =5,justify="center")
ax_area_u,ax_area_d = ttk.Entry(main_frm,width =5,justify="center"),ttk.Entry(main_frm,width =5,justify="center")
ax_space_hspace,ax_space_wspace = ttk.Entry(main_frm,width =5,justify="center"), ttk.Entry(main_frm,width =5,justify="center")

#ボタンの作成
app_btn = ttk.Button(main_frm, text="実行",command = matplot_show)
tkinter、GUIの配置シュミレーション
続いて、作成してきたウイジェットをグリッド内に配置していく作業です。
いきなり作業に入る前にexcelを用いて簡単にシュミレーションするのがお勧めです。今回の配置は以下の様にしてみました。
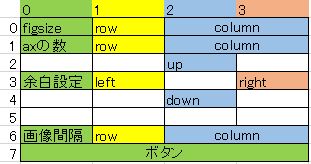
上記図において緑色が0列目、黄色が1列目、水色が2列目、橙色が3列目となります。また、0行目、1行目、6行目はグリッドの結合を行います。
設定は以下となります。
fig_label.grid(row=1, column=0)
fig_row.grid(row=1, column=1)
fig_col.grid(row=1, column=2,columnspan=2)

ax_label.grid(row=2, column=0)
ax_box_row.grid(row=2, column=1)
ax_box_col.grid(row=2, column=2,columnspan=2)

ax_area_u.grid(row=3,column=2)

ax_area_l.grid(row=4,column=1)
ax_area_r.grid(row=4,column=3)

ax_area_d.grid(row=5,column=2)

ax_space.grid(row=6,column=0)
ax_space_hspace.grid(row=6,column=1)
ax_space_wspace.grid(row=6,column=2,columnspan=2)

app_btn.grid(row=7, column=0,columnspan=4)

main_win.mainloop()
Entryウイジェットの初期値を与える
Entryウイジェットで入力できるようにしましたが、全ての項目を入力するのは非常に手間です。なので、初期値を設定しましょう。
初期値の設定は
変数名.insert(初めの文字の場所 , “初期値”)
で設定します。
なので、初期値として
Figsizeを縦5、横4、axesを縦2、横2、余白設定を左と下を0、右と上を1、画像間隔を縦横それぞれ0.1として設定します。
fig_row.insert(0,"4"),fig_col.insert(0,"5")
ax_box_row.insert(0,"2"),ax_box_col.insert(0,"2")
ax_area_l.insert(0,"0"),ax_area_r.insert(0,"1")
ax_area_u.insert(0,"1"),ax_area_d.insert(0,"0")
ax_space_hspace.insert(0,"0.1"),ax_space_wspace.insert(0,"0.1")
を上のコードの下に追加します。
初期値の設定が終わったら、GUIを表示し続けるコード
main_win.mainloop()
を足してください。これがないとGUIが表示されません。
確認
とりあえず、ここまででGUIの部分は完成しましたので実行ボタンの関数を仮で作りプログラムを走らせてみましょう。
モジュールインポートの後、6行目辺りに以下のコードを挿入してください。
def matplot_show():
    pass
完成コードは以下になります。
# -- coding utf-8 --

import tkinter
from tkinter import ttk

def matplot_show():
    pass


# メインウィンドウ
main_win = tkinter.Tk()
main_win.title("matplotlib 領域")
main_win.geometry("230x210")

# メインフレーム
main_frm = ttk.Frame(main_win)
main_frm.grid(column=0, row=0, sticky=tkinter.NSEW)

#ラベルの作成
fig_label = ttk.Label(main_frm, text="figsize",width =10)
ax_label = ttk.Label(main_frm, text="axの数",width =10)
ax_area_row = ttk.Label(main_frm, text="余白設定",width =10)
ax_space = ttk.Label(main_frm, text="画像間隔",width =10)

#Entryの作成
fig_row,fig_col = ttk.Entry(main_frm,width =5,justify="center"),ttk.Entry(main_frm,width =5,justify="center")
ax_box_row,ax_box_col = ttk.Entry(main_frm,width =5,justify="center"),ttk.Entry(main_frm,width =5,justify="center")
ax_area_l,ax_area_r = ttk.Entry(main_frm,width =5,justify="center"),ttk.Entry(main_frm,width =5,justify="center")
ax_area_u,ax_area_d = ttk.Entry(main_frm,width =5,justify="center"),ttk.Entry(main_frm,width =5,justify="center")
ax_space_hspace,ax_space_wspace = ttk.Entry(main_frm,width =5,justify="center"), ttk.Entry(main_frm,width =5,justify="center")

#ボタンの作成
app_btn = ttk.Button(main_frm, text="実行",command = matplot_show)

fig_label.grid(row=1, column=0)
fig_row.grid(row=1, column=1)
fig_col.grid(row=1, column=2,columnspan=2)

ax_label.grid(row=2, column=0)
ax_box_row.grid(row=2, column=1)
ax_box_col.grid(row=2, column=2,columnspan=2)

ax_area_u.grid(row=3,column=2)

ax_area_row.grid(row=4,column=0)
ax_area_l.grid(row=4,column=1)
ax_area_r.grid(row=4,column=3)

ax_area_d.grid(row=5,column=2)

ax_space.grid(row=6,column=0)
ax_space_hspace.grid(row=6,column=1)
ax_space_wspace.grid(row=6,column=2,columnspan=2)

app_btn.grid(row=7, column=0,columnspan=4)

fig_row.insert(0,"4"),fig_col.insert(0,"5")
ax_box_row.insert(0,"2"),ax_box_col.insert(0,"2")
ax_area_l.insert(0,"0"),ax_area_r.insert(0,"1")
ax_area_u.insert(0,"1"),ax_area_d.insert(0,"0")
ax_space_hspace.insert(0,"0.1"),ax_space_wspace.insert(0,"0.1")

main_win.mainloop()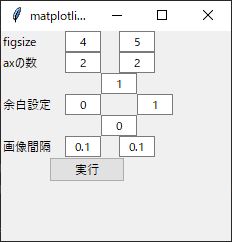
上記の様なGUIが表示されましたか?
ちょっと長くなってしまったので次回matplot_showの関数部分を作成してみたいと思います。
お疲れ様でした。
The post tkinterのGUIを使ってmatplotlibのfigやaxesの配置をシュミレーションできるプログラムを組んでみた① first appeared on 診療放射線技師がPythonをはじめました。.]]>