例えば、前立腺を抽出するセグメンテーションをしたい場合は、学習画像として、元画像と、前立腺だけを抽出した(下の画像右側)のような画像を作成しなければいけません。

ワークステーションを使えばできるのですが、業務終了後に職場に残ってこの作業、やりたくないですよね。自分なら、家で酒でも飲みながら音楽をかけて作業。を望みます。
なので、今回は、この画像を作成するコードを組んでいきます。
コード
最終的なコードは以下となります。
import numpy as np
import cv2
import pydicom
import matplotlib.pyplot as plt
from matplotlib.patches import Circle

def on_motion(event):
    global contour, fig, ax1

    if event.button == 1 :
        contour.append([int(event.xdata), int(event.ydata)])
        ax1.add_patch(Circle((event.xdata, event.ydata), 0.1, color='r'))
        fig.canvas.draw()


def on_button_release(event):
    global contour, mask, ax2

    cv2.fillConvexPoly(mask, np.array(contour), color=255, lineType=cv2.LINE_AA)

    ax2.imshow(mask, cmap='bone')
    fig.canvas.draw()


def main():
    global contour, fig, ax1, ax2, mask

    dcm = pydicom.dcmread('009_IMG11')
    img = dcm.pixel_array

    mask = np.zeros_like(img, dtype=np.uint8)


    ww, wl = dcm[0x0028, 0x1051].value, dcm[0x0028, 0x1050].value
    ww_l, ww_h = wl - ww // 2, wl + ww // 2

    contour= []

    fig = plt.figure(figsize=(10, 5))
    ax1,ax2 = fig.add_subplot(1, 2, 1), fig.add_subplot(1, 2, 2)

    ax1.imshow(img, cmap='bone', vmin=ww_l, vmax=ww_h)

    fig.canvas.mpl_connect('button_release_event', on_button_release)
    fig.canvas.mpl_connect('motion_notify_event', on_motion)

    plt.show()

if __name__ == "__main__":
    main()
流れの説明
コードの流れとしては
- DICOM画像の表示
- マスク画像の作成(DICOM画像と同一の画像サイズで符号なしの8bit画像)
- DICOM画像で領域指定(右クリックを押したままマウス移動)
- マウスを移動させることでその座標をリストに追加していく
- マウスを離すことで領域抽出完了
- マスク画像に領域を描出
といった流れになっていきます。
上記コードで
DICOM画像の表示はmain関数内
DICOM画像で領域抽出は「on_motion」関数
マスク画像に領域を描出は「on_button_release」関数
で指定しています。
領域抽出
領域抽出は、DICOM画像上で抽出する領域をなぞっていくことでその座標を、リストに登録していきます。
ここでは、numpyの配列としてではなく、リストとして扱っていきます。
numpy配列として、2次元データに2次元データをひとつづつ追加していこうとするとちょっと厄介なことが起こるので。。。。。(詳細はいつか記事にしたいと思っています)
リストとして扱っていけば、純粋にappendで追加していけます。
追加する際に、整数型として追加していきます。
contour.append([int(event.xdata), int(event.ydata)])
また、なぞった位置をDICOM画像上に表示しておきたいので
ax1.add_patch(Circle((event.xdata, event.ydata), 0.1, color=’r’))
で画像上にプロットして
fig.canvas.draw()
で画像を再描出しています。
マスク画像に領域を描出 cv2.fillConvexPoly
なぞった座標のリストを別の画像上に描出します。
上記コードの32行目
mask = np.zeros_like(img, dtype=np.uint8)
でマスク画像用の配列をデータ0で作成しています。
配列の型は、マイナスデータなしの8bit画像です。なので階調は0~255となります。
先ほどなぞって登録したリストをmask上に描出します。
この機能は、openCVを使います。
cv2.fillConvexPoly(mask, np.array(contour), color=255, lineType=cv2.LINE_AA)
この関数は矩形を描出し、その中を塗りつぶします。
ここで先ほどの座標データを使うのですが、受けるデータはnumpy配列で整数型しか受けてくれません。
なので、リストに登録する際にint型を指定して追加していました。
そのリストをnumpy配列に変換するのは
np.array(contour)
としてあげるだけでnumpy配列として扱ってくれます。非常に便利です。
で、3番目の引数で255の値を指定してあげます。もし、RGBで指定するのであれば(0,0,0)等で指定してあげれば大丈夫です。ただ、その際にはmask配列作成時にRGBとして配列を作成することを忘れないようにしてください。
これで、先ほどなぞった座標内を255の値として登録することが出来ました。
後は、画像表示して確認です。
さいごに
いかがですか?このコードだけでは何枚もの教師画像を作成するのは大変ですが、根幹となるコードはできました。
このコードがどなたかの役に立てば幸いです。
The post 画像セグメンテーションに必要な教師データ作成ツールを組んでみた first appeared on 診療放射線技師がPythonをはじめました。.]]>さて、今回は畳み込みフィルタをやってみたので記事にしていきます。
お恥ずかしい話、1,2年ぐらい前までよく分かっていませんでした・・・・・
深層学習を勉強するようになってやっと少しずつ理解できるようになってきました。。。。
学生時代、きちんと勉強していなかった事を後悔しています。
それでは本題に入っていきます。
カーネルとは
フィルタはカーネルといわれる配列で指定していきます。
3×3や、5×5といった縦横同一サイズのカーネルで指定していきます。
カーネルの種類
カーネルの種類は無数にあります。
ただ、カーネルの設定次第で鮮鋭化であったり平滑化であったり、エッジ検出であったりといろいろとできます。
その目的とする効果によってカーネルの組み方が変わってきます。
例えば、鮮鋭化であれば隣り合うピクセルの差が大きければ、くっきりとした画像になります。
その為、以下のように中心に接する値にマイナスの値を設定してあげれば鮮鋭化することができます。
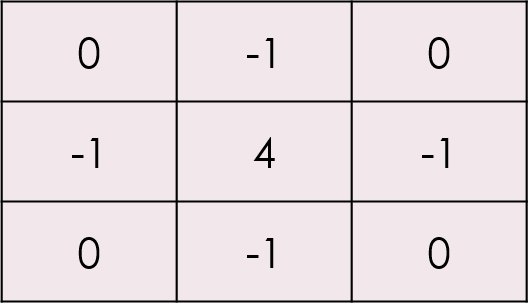
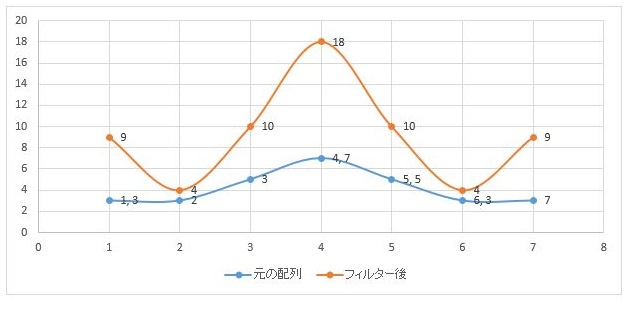
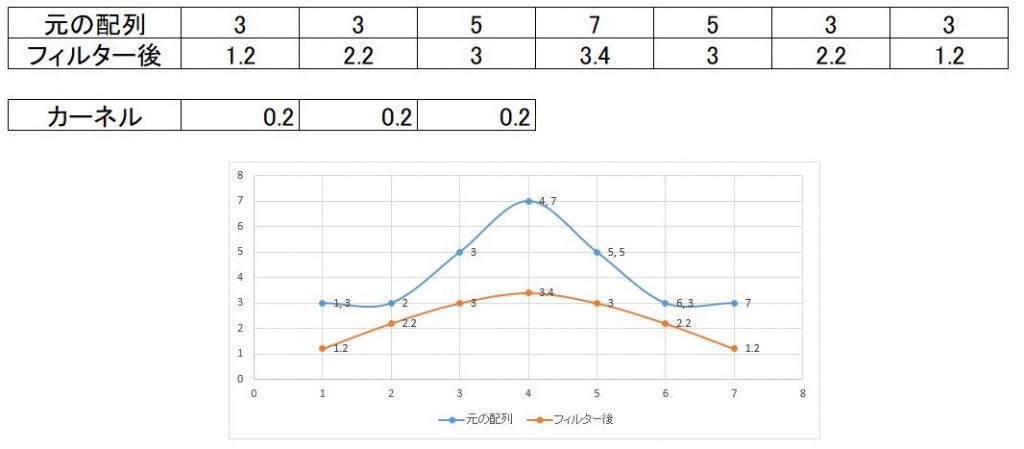
例えば、1次元で試してみましょう。元の配列3,3,5,7,5,3,3という配列があり
それにー1,4,ー1というカーネルを掛け合わせてみると下の様な結果になります。

上記結果をグラフとして表示してみると、下の図の黄色のグラフになり、鮮鋭化されているのが分かります。
逆に、平滑化であれば
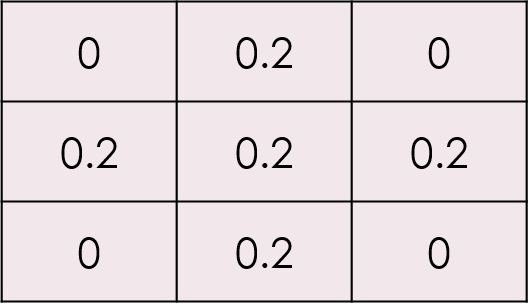
の様にしてあげれば平滑化、いわゆる少しボケたような画像が出来上がります。
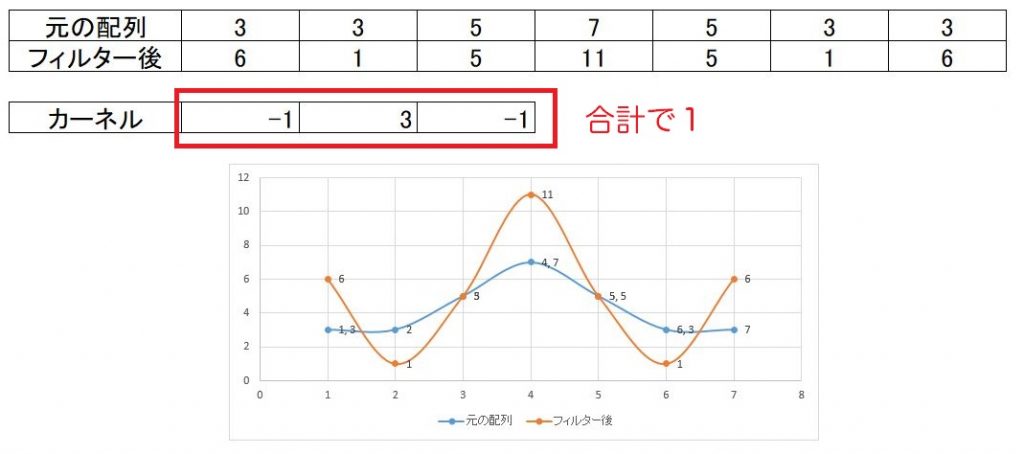
なおフィルタの値は合計で1を超えると明るめの画像となり、1以下であれば暗めの画像になってしまいます。
先の鮮鋭化のフィルタでは1を超えてしまっているので全体的に信号が高くなっています。逆に平滑化のフィルタでは1より小さくなっているので信号は元の青いグラフより低くなっています。
以下では、鮮鋭化フィルタで合計を1にした場合です。平均すると元の値とほぼ変わりません
上記説明では中心から上下左右の4近傍のフィルタで説明しましたが
その他に、上下左右と斜めにも値を入れた8近傍フィルタもあります。
コード
それでは実際のコードです。今回はopenCVを用いて行います。
cv2.filter2D(元画像の配列, -1, kernel)
で畳み込みフィルタができます。
なお、引数に関してはこれ以外にももう少しあるようです。気になる方はgoogle先生にお尋ねください。
今回、私が試してみたコードが以下になります。
import numpy as np
import pydicom
import matplotlib.pyplot as plt
import cv2


def main():


    filenames = "MR000002"
    dcm = pydicom.dcmread(filenames)


    window_center , window_width = dcm[0x0028,0x1050].value,  dcm[0x0028,0x1051].value
    ww_low, ww_high  = int(window_center) - int(window_width) // 2, int(window_center) + int(window_width) // 2

    pix_arr = dcm.pixel_array
    pix_arr_fil1 = dcm.pixel_array
    pix_arr_fil2 = dcm.pixel_array

    mag1, k1  = 9, -1
    mag2, k2, k0 = 5, -1, 0

    kernel8 = np.array([[k1, k1, k1],
                       [k1, mag1, k1],
                       [k1, k1, k1]])

    print(kernel8)

    kernel4 = np.array([[k0, k2, k0],
                        [k2, mag2, k2],
                        [k0, k2, k0]])

    print(kernel4)

    pix_arr_fil1 = cv2.filter2D(pix_arr_fil1, -1, kernel8)
    pix_arr_fil2 = cv2.filter2D(pix_arr_fil2, -1, kernel4)


    fig = plt.figure(figsize=(18, 7))
    ax1 = fig.add_subplot(1, 3, 1)
    ax2 = fig.add_subplot(1, 3, 2)
    ax3 = fig.add_subplot(1, 3, 3)

    plt.subplots_adjust(left=0, right=1, bottom=0, top=1, wspace=0.02, hspace=0.005)

    ax1.axes.xaxis.set_visible(False), ax1.axes.yaxis.set_visible(False)
    ax2.axes.xaxis.set_visible(False), ax2.axes.yaxis.set_visible(False)
    ax3.axes.xaxis.set_visible(False), ax3.axes.yaxis.set_visible(False)

    ax1.imshow(pix_arr, cmap='bone', vmin=ww_low, vmax=ww_high)
    ax2.imshow(pix_arr_fil1, cmap='bone', vmin=ww_low, vmax=ww_high)
    ax3.imshow(pix_arr_fil2, cmap='bone', vmin=ww_low, vmax=ww_high)

    plt.show()

if __name__ == '__main__':
    main()
24~26行目に8近傍のカーネル
30~32行目に4近傍のカーネルを設定してあります。
なおカーネルの値はそれぞれ、21行目と22行目で設定できるようにしています。
結果
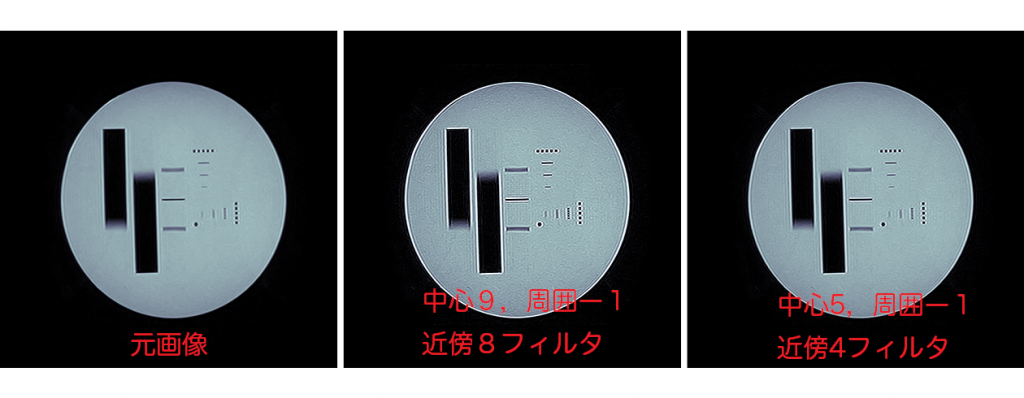
鮮鋭化フィルタ (画像をクリックすると拡大します)
平滑化フィルタ (画像をクリックすると拡大します)
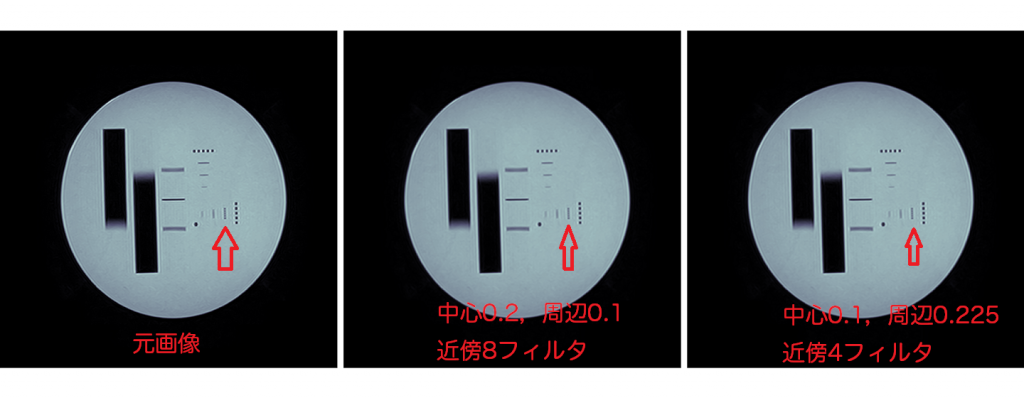
平滑化フィルタはこの画像ではわかりずらいかもしれませんね。興味のある方は他の画像で試してみてください。
The post 畳み込みフィルタを試してみた ~OpenCV~ first appeared on 診療放射線技師がPythonをはじめました。.]]>
前回、画像領域値をせて値を確認できるプログラムを組んでみたをベースとして画像領域を一つ追加し、4種類の領域抽出できるプログラムを組みました。
今回は、それらプログラムを連結させてプログラムとして完成させましょう。
前回までのプログラム
import tkinter as tk
import cv2
import matplotlib.pyplot as plt
from matplotlib.backends.backend_tkagg import FigureCanvasTkAgg
import numpy as np
import pydicom
import fileselect as fs

def cont():
    img_unit8 = copy.deepcopy(img_arr) #img_unit8としてコピー
    np.clip(img_unit8, ww_low, ww_high, out= img_unit8)
      #コピーした配列の最低値以下をウインドウ幅最低値に、
       # 最高値以上も同様に)

    img_unit8 -= img_unit8.min()
      #配列全体をウインドウ幅最低値を引くことで0からに変更)

    np.floor_divide(img_unit8, (img_unit8.max() + 1) / 256,
            out = img_unit8, casting='unsafe')
      #ウインドウ幅を256分割する。

    cv2.imwrite('./img_8bit.png',img_unit8)

def external():
    img_png = cv2.imread('img_8bit.png')
    thresh_8bit = thresh.astype('u1')
    ret, contours, hierarchy = cv2.findContours(thresh_8bit, 0,   cv2.CHAIN_APPROX_SIMPLE)

    for contour in contours:
        cv2.drawContours(img_png, contours, -1, (255, 255, 0), 1)

    ax3.imshow(img_png, cmap='bone')
    fig.canvas.draw()

def list():
    img_png = cv2.imread('img_8bit.png')
    thresh_8bit = thresh.astype('u1')
    ret, contours, hierarchy = cv2.findContours(thresh_8bit, 1,  cv2.CHAIN_APPROX_SIMPLE)

    for contour in contours:
        cv2.drawContours(img_png, contours, -1, (255, 255, 0), 1)

    ax3.imshow(img_png, cmap='bone')
    fig.canvas.draw()

def ccomp():
    img_png = cv2.imread('img_8bit.png')
    thresh_8bit = thresh.astype('u1')
    ret, contours, hierarchy = cv2.findContours(thresh_8bit, 2, cv2.CHAIN_APPROX_SIMPLE)

    for contour in contours:
        cv2.drawContours(img_png, contours, -1, (255, 255, 0), 1)

    ax3.imshow(img_png, cmap='bone')
    fig.canvas.draw()

def tree():
    img_png = cv2.imread('img_8bit.png')
    thresh_8bit = thresh.astype('u1')
    ret, contours, hierarchy = cv2.findContours(thresh_8bit, 3,   cv2.CHAIN_APPROX_SIMPLE)

    for contour in contours:
        cv2.drawContours(img_png, contours, -1, (255, 255, 0), 1)

    ax3.imshow(img_png, cmap='bone')
    fig.canvas.draw()

def level():
    global ww_low, ww_high, w_level, w_width

    window_level, window_width = level_sc.get(), w_width_sc.get()

    ww_low = window_level - (window_width // 2)
    ww_high = window_level + (window_width // 2)

def window(self):
    global ww_low, ww_high, img_arr, ax1

    level()

    ax1.imshow(img_arr, cmap='bone', vmin=ww_low, vmax=ww_high)
    fig.canvas.draw()

def thresho(self):
    global img_arr, ax2, fig

    ret, thresh = cv2.threshold(img_arr, int(self), 255, cv2.THRESH_BINARY)
    ax2.imshow(thresh, cmap='bone')

    fig.canvas.draw()

def main():
    global ww_low, ww_high, img_arr, thre_sc, ax2, fig,\
        img_arr, ax1, level_sc, w_width_sc, ww_low, ww_high, w_level, w_width


    filename = fs.single_fileselect()
    dcm = pydicom.dcmread(filename)
    img_arr = np.array(dcm.pixel_array)
    w_level = int(dcm[0x0028,0x1050].value)
    w_width = int(dcm[0x0028, 0x1051].value)

    fig = plt.figure(figsize=(12, 6))
    ax1 = fig.add_subplot(1, 3, 1)
    ax2 = fig.add_subplot(1, 3, 2)
    ax3 = fig.add_subplot(1, 3, 3)

    ax1.axes.xaxis.set_visible(False), ax1.axes.yaxis.set_visible(False)
    ax2.axes.xaxis.set_visible(False), ax2.axes.yaxis.set_visible(False)
    ax3.axes.xaxis.set_visible(False), ax3.axes.yaxis.set_visible(False)


    root = tk.Tk()
    root.geometry("1410x600")

    Canvas = FigureCanvasTkAgg(fig, master=root)
    Canvas.get_tk_widget().grid(row=0, column=0, rowspan=10)


    var_scale_level = tk.IntVar()
    level_sc = tk.Scale(root,
        label='Window Level',
        variable=var_scale_level,
        orient=tk.HORIZONTAL,
        length=200,
        from_= np.min(img_arr),
        to=np.max(img_arr),
        command=window)
    level_sc.set(w_level)
    level_sc.grid(row=1, column=1)

    var_scale_w_width = tk.IntVar()
    w_width_sc = tk.Scale(root,
        label = 'Window Width',
        variable=var_scale_w_width,
        orient=tk.HORIZONTAL,
        length=200,
        from_=0,
        to=(np.max(img_arr) - np.min(img_arr))//2,
        command=window)
    w_width_sc .set(w_width)
    w_width_sc.grid(row=3, column=1)


    thre = 0

    var_thre = tk.IntVar()
    thre_sc = tk.Scale(root,
        label='Threshold',
        variable=var_thre,
        orient=tk.HORIZONTAL,
        length=200,
        from_=np.min(img_arr),
        to=np.max(img_arr),
        command=thresho)
    thre_sc.set(thre)
    thre_sc.grid(row=5, column=1)


    ext_but = tk.Button(root, text="EXTERNAL", command=external, width = 10)
    ext_but.grid(row=8, column=1)

    list_but = tk.Button(root, text="LIST", command=list, width = 10)
    list_but.grid(row=8, column=2)

    ccomp_but = tk.Button(root, text="CCOMP", command=ccomp, width = 10)
    ccomp_but.grid(row=9, column=1)

    TREE_but = tk.Button(root, text="TREE", command=tree, width = 10)
    TREE_but.grid(row=9, column=2)

    window(1)
    thresho(1)

    root.mainloop()

if __name__ == "__main__":
    main()
今回の流れ
それでは、今回の流れです。
前回は4つの領域抽出のプログラムを作成しましたが、流れとして繋がっていないのでまずは、これを繋げて動くようにしたいと思います。
その後、領域抽出した面積や、周囲の長さを求めるコードを書いていきたいと思います。
ボタンに関数を紐づける
それぞれのボタンが押された時の動作を紐づけます。
ボタンを作成した際にcommandの引数で指定してあげることで動作を紐づけることが出来ます。
ext_but = tk.Button(root, text=”EXTERNAL”, command=external, width = 10)
作成した4つのボタンに関数の紐づけをしましょう。
領域抽出までのプログラムを繋げる
それでは、繋げていきたいと思います。
領域抽出のボタンが押された際に、まず一番左の画像を汎用画像として保存するプログラムを走らせます。その後に領域抽出を行う必要があります。
関数のexternal,list,ccomp,treeの関数が呼び出された際にまず、contの関数を呼び出し、左側の画像を汎用画像として保存させますので、それぞれの関数の初めに
cont()
と4つの関数の初めに入力しておきましょう。
そして、保存した画像を読み込みます。
img_png = cv2.imread(‘img_8bit.png’)
これで、プログラムが動くようになりました。
抽出領域の面積、長さを求める
抽出した領域の面積は、
cv2.contourArea()
周囲の長さを求めるのは
cv2.arcLength()
で求めることが出来ます。ただ、この関数の場合は第2引数が必要で、閉じている線(True)か閉じていない線(False)なのかを指定してあげる必要があります。
ちなみに、重心を求めるのは
cv2.moments()
で求めることが出来ます。
それぞれ、引数にはcontoursの何番目のデータかを指定する必要があります。
それでは、これも関数として作成しましょう。
関数名はcont_momentとして作成しました。
その際、それぞれの領域抽出した結果を引数として受けることにします。
後は、for文で回して格納してある分だけプロントアウトしていくだけです。
def cont_moment(contours):
    print('I got ' + str(len(contours)) + ' contours')

    for i in range(len(contours)):
        print('Contour area\t' + str(cv2.contourArea(contours[i])) + '\t arc length\t' + str(cv2.arcLength(contours[i],True)))
そして、4つの領域抽出の関数の最後に
cont_moment(contours)
を追加します。
値を微調整できるボタンを設置
私のコードがいけないのか、パソコンのスペックが低いのか、スライダーを動かすと動作がカクついてしまうので5程度づつ調整できるボタンを設置したいと思います。
ボタンの設置は領域抽出の時と同じです。
例えば、ウインドウレベルの場合は以下の様にボタンの設置を行います。
down_wl_btn = tk.Button(root, text="down", command=down_wl)
down_wl_btn.grid(row=2, column=1)

up_wl_btn = tk.Button(root, text=" up ", command=up_wl)
up_wl_btn.grid(row=2, column=2)
コマンドの関数は以下になります。
def down_wl():
    val = level_sc.get() - 5
    level_sc.set(val)

def up_wl():
    val = level_sc.get() + 5
    level_sc.set(val)
現在のスケールの値とそこから増減したい数値を増減した値(今回は5増減)をvalという変数に持たせ、それをスケールの値にセットする形になります。
スケールにセットするやり方は
スケール名.set(値)
で出来ます。
ウインドウ幅、閾値に関しても同様に作成してください
追加
忘れていました・・・・・
画像領域を追加した際にax3を追加しました。
しかし、このax3はmain関数の中で宣言していますので、他の関数では使うことが出来ませんのでグローバル宣言をしておきましょう。
main関数 def main(): のすぐ下にglobalと記載がありますが、そこにax3を追加します。
同様にthreshも追加してください。また、threshはスケールを動かした時にも変化しますので関数threshoにおいてもthreshをグローバル化しておいてください
あと、汎用画像を作成する際に配列をコピーするのに、copyというライブラリーを使用していませんがインポートしていませんでした。
import copy
と追加してください。
調整
プログラムは完成しましたが、最終的に見た目の調整をします。
今までのコードを実行すると以下のような画面となり、ちょっとカッコ悪いので調整していきたいと思います。
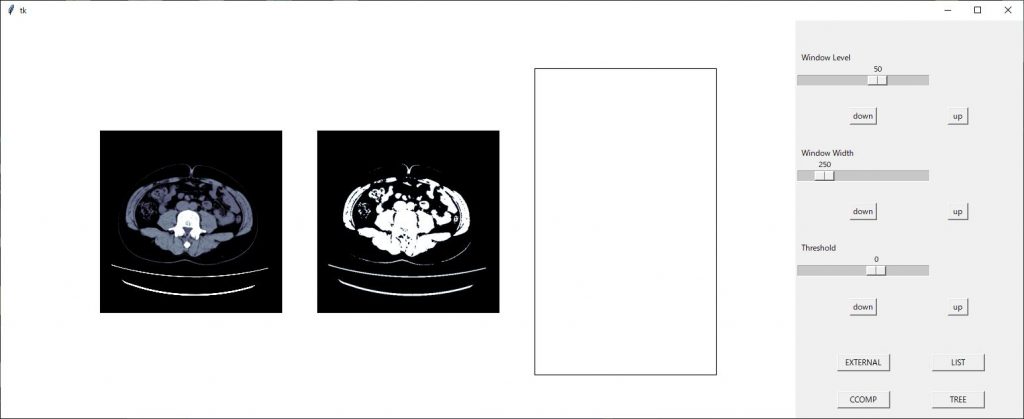
まずは、画像間隔を調整します。
axの軸設定の後に
plt.subplots_adjust(left=0.01, right=0.995, bottom=0, top=1, wspace=0.01)
のコードを挿入し画像間隔を設定します。詳しくはこちら
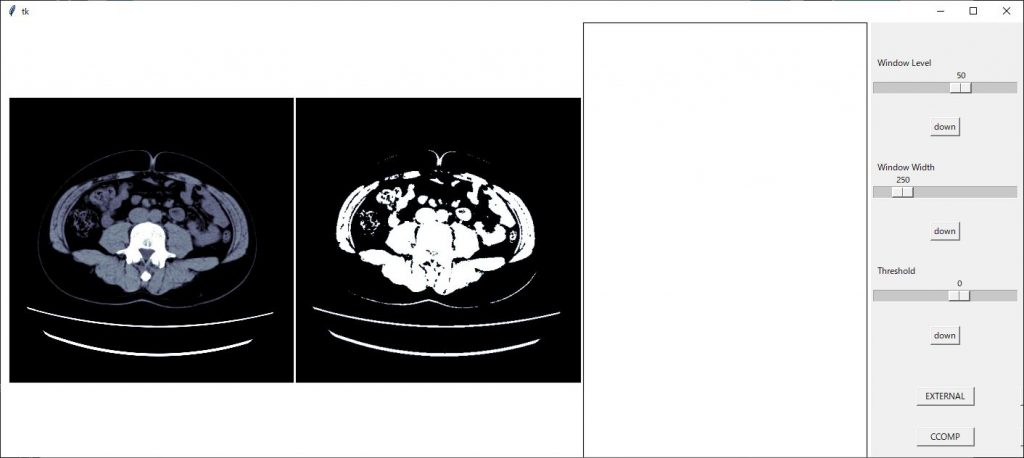
画像間隔が狭まりました。
新たに作成したax3の領域が大きいので画像サイズを(13,4)に変更してみます。
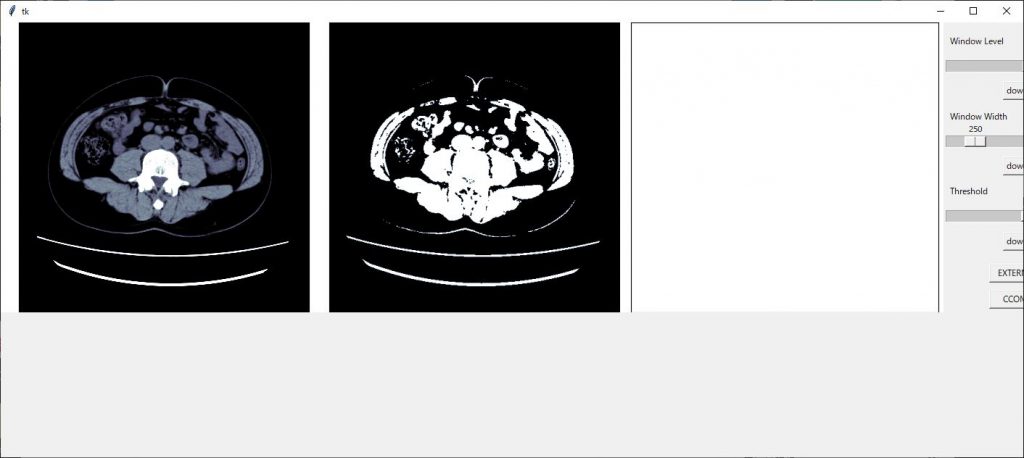
整ってきました、スケールの部分が切れてしまっているので領域のジオメトリーを 1510×500 に変更します
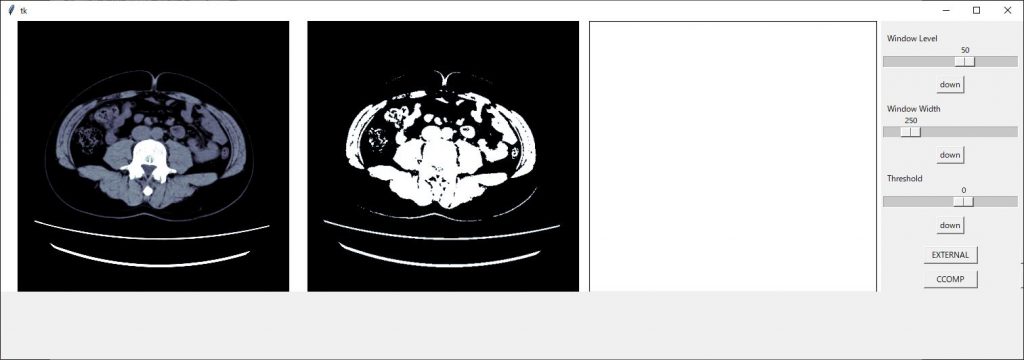
後はボタン類の配置を修正すれば見栄えが良くなりそうです
スケールの配置で1枠を使ってしまっているので2つを使い表示させるようにします。
スケールの設定で columnspan = 2
2枠を使った表示にできますのでそれぞれのスケールに追加します。
w_width_sc.grid(row=3, column=1,columnspan=2)
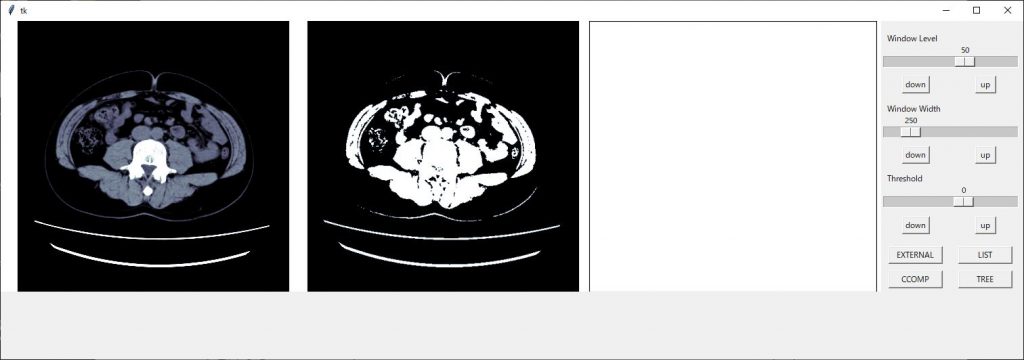
きれいに整いました!!
完成したコード
import tkinter as tk
import cv2
import matplotlib.pyplot as plt
from matplotlib.backends.backend_tkagg import FigureCanvasTkAgg
import numpy as np
import pydicom
import fileselect as fs
import copy

def cont():
    img_unit8 = copy.deepcopy(img_arr) #img_unit8としてコピー
    np.clip(img_unit8, ww_low, ww_high, out= img_unit8)
      #コピーした配列の最低値以下をウインドウ幅最低値に、
      # 最高値以上も同様に)

    img_unit8 -= img_unit8.min()
      #配列全体をウインドウ幅最低値を引くことで0からに変更)

    np.floor_divide(img_unit8, (img_unit8.max() + 1) / 256,
            out = img_unit8, casting='unsafe')
      #ウインドウ幅を256分割する。

    cv2.imwrite('./img_8bit.png',img_unit8)

def external():
    cont()
    img_png = cv2.imread('img_8bit.png')
    thresh_8bit = thresh.astype('u1')
    ret, contours, hierarchy = cv2.findContours(thresh_8bit, 0,   cv2.CHAIN_APPROX_SIMPLE)

    for contour in contours:
        cv2.drawContours(img_png, contours, -1, (255, 255, 0), 1)

    ax3.imshow(img_png, cmap='bone')
    fig.canvas.draw()
    cont_moment(contours)

def list():
    cont()

    img_png = cv2.imread('img_8bit.png')
    thresh_8bit = thresh.astype('u1')
    ret, contours, hierarchy = cv2.findContours(thresh_8bit, 1,  cv2.CHAIN_APPROX_SIMPLE)

    for contour in contours:
        cv2.drawContours(img_png, contours, -1, (255, 255, 0), 1)

    ax3.imshow(img_png, cmap='bone')
    fig.canvas.draw()
    cont_moment(contours)

def ccomp():
    cont()
    img_png = cv2.imread('img_8bit.png')
    thresh_8bit = thresh.astype('u1')
    ret, contours, hierarchy = cv2.findContours(thresh_8bit, 2, cv2.CHAIN_APPROX_SIMPLE)

    for contour in contours:
        cv2.drawContours(img_png, contours, -1, (255, 255, 0), 1)

    ax3.imshow(img_png, cmap='bone')
    fig.canvas.draw()
    cont_moment(contours)

def tree():
    cont()
    img_png = cv2.imread('img_8bit.png')
    thresh_8bit = thresh.astype('u1')
    ret, contours, hierarchy = cv2.findContours(thresh_8bit, 3,   cv2.CHAIN_APPROX_SIMPLE)

    for contour in contours:
        cv2.drawContours(img_png, contours, -1, (255, 255, 0), 1)

    ax3.imshow(img_png, cmap='bone')
    fig.canvas.draw()
    cont_moment(contours)

def cont_moment(contours):
    print('I got ' + str(len(contours)) + ' contours')

    for i in range(len(contours)):
        print('Contour area\t' + str(cv2.contourArea(contours[i])) + '\t arc length\t' + str(cv2.arcLength(contours[i],True)))


def level():
    global ww_low, ww_high, w_level, w_width

    window_level, window_width = level_sc.get(), w_width_sc.get()

    ww_low = window_level - (window_width // 2)
    ww_high = window_level + (window_width // 2)

def window(self):
    global ww_low, ww_high, img_arr, ax1

    level()

    ax1.imshow(img_arr, cmap='bone', vmin=ww_low, vmax=ww_high)
    fig.canvas.draw()

def thresho(self):
    global img_arr, ax2, fig
, thresh

    ret, thresh = cv2.threshold(img_arr, int(self), 255, cv2.THRESH_BINARY)
    ax2.imshow(thresh, cmap='bone')

    fig.canvas.draw()

def up():
    val = thre_sc.get() + 5
    thre_sc.set(val)

def down():
    val = thre_sc.get() - 5
    thre_sc.set(val)

def down_wl():
    val = level_sc.get() - 5
    level_sc.set(val)

def up_wl():
    val = level_sc.get() + 5
    level_sc.set(val)


def down_ww():
    val = level_sc.get() - 5
    level_sc.set(val)


def up_ww():
    val = level_sc.get() + 5
    level_sc.set(val)

def main():

    global ww_low, ww_high, img_arr, thre_sc, ax2, fig, \
        img_arr, ax1, level_sc, w_width_sc, ww_low, ww_high, w_level, w_width, \
        ax3, thresh


    filename = fs.single_fileselect()
    dcm = pydicom.dcmread(filename)
    img_arr = np.array(dcm.pixel_array)
    w_level = int(dcm[0x0028,0x1050].value)
    w_width = int(dcm[0x0028, 0x1051].value)

    fig = plt.figure(figsize=(13, 4))
    ax1 = fig.add_subplot(1, 3, 1)
    ax2 = fig.add_subplot(1, 3, 2)
    ax3 = fig.add_subplot(1, 3, 3)

    ax1.axes.xaxis.set_visible(False), ax1.axes.yaxis.set_visible(False)
    ax2.axes.xaxis.set_visible(False), ax2.axes.yaxis.set_visible(False)
    ax3.axes.xaxis.set_visible(False), ax3.axes.yaxis.set_visible(False)
    plt.subplots_adjust(left=0.01, right=0.995, bottom=0, top=1, wspace=0.01)


    root = tk.Tk()
    root.geometry("1510x500")

    Canvas = FigureCanvasTkAgg(fig, master=root)
    Canvas.get_tk_widget().grid(row=0, column=0, rowspan=10)


    var_scale_level = tk.IntVar()
    level_sc = tk.Scale(root,
        label='Window Level',
        variable=var_scale_level,
        orient=tk.HORIZONTAL,
        length=200,
        from_= np.min(img_arr),
        to=np.max(img_arr),
        command=window)
    level_sc.set(w_level)
    level_sc.grid(row=1, column=1,columnspan=2)

    down_wl_btn = tk.Button(root, text="down", command=down_wl)
    down_wl_btn.grid(row=2, column=1)

    up_wl_btn = tk.Button(root, text=" up ", command=up_wl)
    up_wl_btn.grid(row=2, column=2)

    var_scale_w_width = tk.IntVar()
    w_width_sc = tk.Scale(root,
        label = 'Window Width',
        variable=var_scale_w_width,
        orient=tk.HORIZONTAL,
        length=200,
        from_=0,
        to=(np.max(img_arr) - np.min(img_arr))//2,
        command=window)
    w_width_sc .set(w_width)
    w_width_sc.grid(row=3, column=1,columnspan=2)

    down_ww_btn = tk.Button(root, text="down", command=down_ww)
    down_ww_btn.grid(row=4, column=1)

    up_ww_btn = tk.Button(root, text=" up ", command=up_ww)
    up_ww_btn.grid(row=4, column=2)

    thre = 0

    var_thre = tk.IntVar()
    thre_sc = tk.Scale(root,
        label='Threshold',
        variable=var_thre,
        orient=tk.HORIZONTAL,
        length=200,
        from_=np.min(img_arr),
        to=np.max(img_arr),
        command=thresho)
    thre_sc.set(thre)
    thre_sc.grid(row=5, column=1)

    down_btn = tk.Button(root, text="down", command=down)
    down_btn.grid(row=6, column=1,columnspan=2)

    up_btn = tk.Button(root, text=" up ", command=up)
    up_btn.grid(row=6, column=2)

    ext_but = tk.Button(root, text="EXTERNAL", command=external, width = 10)
    ext_but.grid(row=8, column=1)

    list_but = tk.Button(root, text="LIST", command=list, width = 10)
    list_but.grid(row=8, column=2)

    ccomp_but = tk.Button(root, text="CCOMP", command=ccomp, width = 10)
    ccomp_but.grid(row=9, column=1)

    TREE_but = tk.Button(root, text="TREE", command=tree, width = 10)
    TREE_but.grid(row=9, column=2)

    window(1)
    thresho(1)

    root.mainloop()

if __name__ == "__main__":
    main()
最後に
いかがでしたか?領域抽出のプログラムきちんと動きましたか?
このコードを更に発展させていけば、内臓脂肪計測のプログラムも作れそうですね。
興味のある方は挑戦してみてください。
お疲れ様でした。
環境
- windows10
- python3.6.1
- Anaconda custom(64-bit)
- PyCharm2020.2(Communication Edition)
プログラムの流れ
プログラム作成の流れを組んでみたいと思います。
まずは、前回組んだ
領域抽出の設定、閾値設定を確認できるプログラムを組んでみたをベースに機能拡張していきたいと思います。
画像表示部分を一つ追加し、そこに領域抽出した画像を表示します。
また、openCVの領域抽出は4種類ありますので、それら抽出方法を選べるように4つのボタンを配置します。
また、領域抽出した領域の面積および、外周の長さを表示するようにします。
最後に、プログラムの組み方が悪いのか、私のPCのスペックが低いのか、スケールを動かした時の動作が遅くなるので、それぞれのスケールの値を一定数増加、減少することができるボタンを配置したいと思います。
- 画像領域を一つ追加
- 4種類の領域抽出ボタンを追加
- 抽出結果を表示
- スケールの増減ボタンを配置
最終的には以下のようになります。
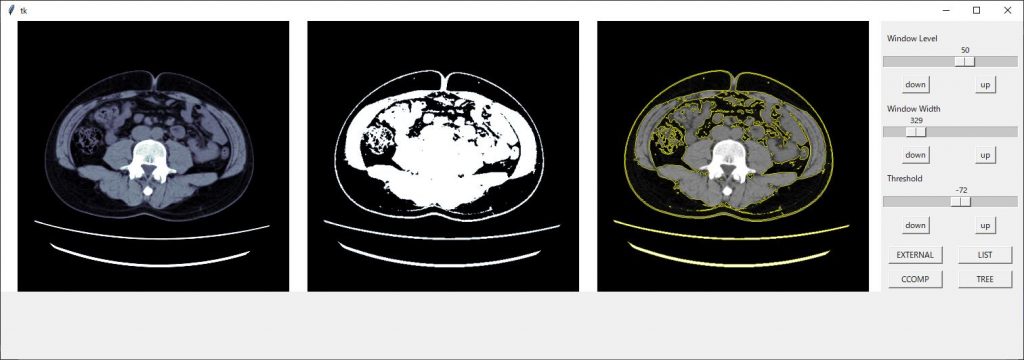
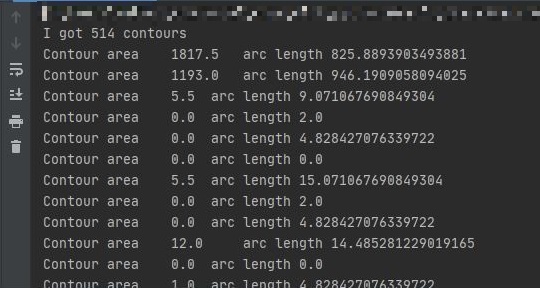
前回のコード
前回のコードは以下になります
import tkinter as tk
import cv2
import matplotlib.pyplot as plt
from matplotlib.backends.backend_tkagg import FigureCanvasTkAgg
import numpy as np
import pydicom
import fileselect as fs


def level():
    global ww_low, ww_high, w_level, w_width

    window_level, window_width = level_sc.get(), w_width_sc.get()

    ww_low = window_level - (window_width // 2)
    ww_high = window_level + (window_width // 2)

def window(self):
    global ww_low, ww_high, img_arr, ax1

    level()

    ax1.imshow(img_arr, cmap='bone', vmin=ww_low, vmax=ww_high)
    fig.canvas.draw()

def thresho(self):
    global img_arr, ax2, fig

    ret, thresh = cv2.threshold(img_arr, int(self), 255, cv2.THRESH_BINARY)
    ax2.imshow(thresh, cmap='bone')

    fig.canvas.draw()


def main():
    global ww_low, ww_high, img_arr, thre_sc, ax2, fig,\
        img_arr, ax1, level_sc, w_width_sc, ww_low, ww_high, w_level, w_width


    filename = fs.single_fileselect()
    dcm = pydicom.dcmread(filename)
    img_arr = np.array(dcm.pixel_array)
    w_level = int(dcm[0x0028,0x1050].value)
    w_width = int(dcm[0x0028, 0x1051].value)

    fig = plt.figure(figsize=(12, 6))
    ax1 = fig.add_subplot(1, 2, 1)
    ax2 = fig.add_subplot(1, 2, 2)

    ax1.axes.xaxis.set_visible(False), ax1.axes.yaxis.set_visible(False)
    ax2.axes.xaxis.set_visible(False), ax2.axes.yaxis.set_visible(False)


    root = tk.Tk()
    root.geometry("1410x600")

    Canvas = FigureCanvasTkAgg(fig, master=root)
    Canvas.get_tk_widget().grid(row=0, column=0, rowspan=10)


    var_scale_level = tk.IntVar()
    level_sc = tk.Scale(root,
        label='Window Level',
        variable=var_scale_level,
        orient=tk.HORIZONTAL,
        length=200,
        from_= np.min(img_arr),
        to=np.max(img_arr),
        command=window)
    level_sc.set(w_level)
    level_sc.grid(row=1, column=1)

    var_scale_w_width = tk.IntVar()
    w_width_sc = tk.Scale(root,
        label = 'Window Width',
        variable=var_scale_w_width,
        orient=tk.HORIZONTAL,
        length=200,
        from_=0,
        to=(np.max(img_arr) - np.min(img_arr))//2,
        command=window)
    w_width_sc .set(w_width)
    w_width_sc.grid(row=3, column=1)


    thre = 0

    var_thre = tk.IntVar()
    thre_sc = tk.Scale(root,
        label='Threshold',
        variable=var_thre,
        orient=tk.HORIZONTAL,
        length=200,
        from_=np.min(img_arr),
        to=np.max(img_arr),
        command=thresho)
    thre_sc.set(thre)
    thre_sc.grid(row=5, column=1)

    window(1)
    thresho(1)

    root.mainloop()

if __name__ == "__main__":
    main()
コードを組んでいく
それでは、流れに沿ってコードを組んでいきたいと思います
画像領域を一つ追加
ここは単純に上記コードの49行目と52行目にax3として追加していきます。
追加コードは以下
ax3 = fig.add_subplot(1, 3, 3)
ax3.axes.xaxis.set_visible(False), ax3.axes.yaxis.set_visible(False)
ax3の追加に伴い47行目、48行目は真ん中の数字が”2”から”3”に変更になります。
ax1 = fig.add_subplot(1, 3, 1)
ax2 = fig.add_subplot(1, 3, 2)
4種類の領域抽出ボタンを追加
tkinterのボタンの設置は
ボタンの名前 = tkinter.Button(配置するフィールド, text=”ボタン上に表示する文字”, command=ボタンを押した時の動作, width = ボタンの幅)
で設定し、
ボタンの名前.grid(row=8, column=1)
で表示場所の指定をします。
今回はopenCVの領域抽出方法である”EXTERNAL”、”LIST”、”CCOMP”、”TREE”の4つのボタンを配置します。
コードは以下となります。
ext_but = tk.Button(root, text="EXTERNAL", command=external, width = 10)
ext_but.grid(row=8, column=1)

list_but = tk.Button(root, text="LIST", command=list, width = 10)
list_but.grid(row=8, column=2)

ccomp_but = tk.Button(root, text="CCOMP", command=ccomp, width = 10)
ccomp_but.grid(row=9, column=1)

TREE_but = tk.Button(root, text="TREE", command=tree, width = 10)
TREE_but.grid(row=9, column=2)
上記コードを
window(1)
の前、大体100行目辺りになると思います。に記載しましょう。
抽出結果を表示
抽出結果を一番右側の画像表示領域に表示するコードに入ります。
初めに、領域を抽出するのはDICOM画像の配列でもできますが8ビット階調に変換する必要があります。
結果を画像上に重ね合わせるのは8ビット階調の汎用画像(jpgや、png画像)でなければならないという事。
なので、まずは4つのボタンが押された時に、まず汎用画像を作成する事を行わなければなりません。
手間は増えますが、階調を合わせた一番左の画像に重ね合わせたいので一番左の画像を一度汎用画像として保存してそれを使いたいと思います。
汎用画像に保存
一番左側の画像条件で画像を一度汎用画像に保存します。DICOM画像は16ビット画像なので8ビット画像に変換する必要があります。
とりあえず、画像配列をコピーしウインドウ幅の最低値以下のピクセル値を最低の値に、ウインドウ幅の最高値以上のピクセル値を最大の値に変えます。
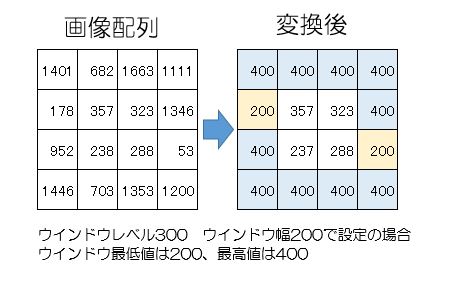
その後、ウインドウ幅を0~256の階調に割り振ります。
そして、img_8bit.pngという名前で、プログラムがあるフォルダに保存します。
これらコードを関数としておきましょう。今回はcontという名前で作成しました。
def cont():
    img_unit8 = copy.deepcopy(img_arr) #img_unit8としてコピー

    np.clip(img_unit8, ww_low, ww_high, out= img_unit8)
          #コピーした配列の最低値以下をウインドウ幅最低値に、
           # 最高値以上も同様に)

    img_unit8 -= img_unit8.min()
          #配列全体をウインドウ幅最低値を引くことで0からに変更)

    np.floor_divide(img_unit8, (img_unit8.max() + 1) / 256,
                out = img_unit8, casting='unsafe')
          #ウインドウ幅を256分割する。

    cv2.imwrite('./img_8bit.png',img_unit8)
領域抽出のプログラム
領域抽出は、閾値設定した配列 ”thresh” で行います。(以前のコード29行目で定義)以前のプログラムで閾値設定した配列は ”thresh” という変数名で持っています。
しかし、先ほども記載しましたが領域抽出は8ビット階調の配列でなければいけないので16ビットの配列を8ビット階調に変換します。
thresh_8bit = thresh.astype('u1')
ここで、”u1”とは符号なしの8ビット整数型を示します。
今、階調変換した配列を用いて領域抽出を行います。
ret, contours, hierarchy = cv2.findContours(thresh_8bit, 0, cv2.CHAIN_APPROX_SIMPLE)
最新バージョンのfindContoursの戻り値は3つから2つに変わり、retの戻り値は廃止になった模様です。もし、エラーが出た場合、retを削除してから試してください。
領域抽出の結果はcontoursに入っています。それらを先ほど保存した汎用画像の上に表示していきます。
表示には
cv2.drawContours(img_png, contours, -1, (255, 255, 0), 1)
で表示できますので、これをfor文で表示していきます。drowContoursについて詳しくはチュートリアルをご覧ください
以上の工程を領域抽出方法4個分の関数として作成していきます。
例えば、 cv2.RETR_LISTの場合
def list():
    cont()
    #ping画像の作成関数
    img_png = cv2.imread('img_8bit.png')  #作成した画像の読み込み

    thresh_8bit = thresh.astype('u1')
 #閾値配列を8ビット化

    ret, contours, hierarchy = cv2.findContours(thresh_8bit, 1,cv2.CHAIN_APPROX_SIMPLE)

    for contour in contours:
        cv2.drawContours(img_png, contours, -1, (255, 255, 0), 1)
    ax3.imshow(img_png, cmap='bone')

    fig.canvas.draw()
ちなみに、findContoursの第2引数は領域抽出の方法なのですが、4つの種類が用意されていて以下の様になっています。
| 抽出方法 | 番号 | 内容 |
| cv2.RETR_EXTERNAL | 0 | 輪郭のうち、最も外側のみ抽出 |
| cv2.RETR_LIST | 1 | 全ての輪郭を抽出 |
| cv2.RETR_CCOMP | 2 | 全ての輪郭を2レベルの階層に分けて出力 |
| cv2.RETR_TREE | 3 | 抽出した内側の輪郭も抽出 |
抽出方法の”cv2.RETR_LIST”などの文字列でも指定できますが、番号でも指定できます。
4つの抽出方法の関数は以下のようになります。
def external():
    img_png = cv2.imread('img_8bit.png')
    thresh_8bit = thresh.astype('u1')
    ret, contours, hierarchy = cv2.findContours(thresh_8bit, 0,   cv2.CHAIN_APPROX_SIMPLE)

    for contour in contours:
        cv2.drawContours(img_png, contours, -1, (255, 255, 0), 1)

    ax3.imshow(img_png, cmap='bone')
    fig.canvas.draw()

def list():
    img_png = cv2.imread('img_8bit.png')
    thresh_8bit = thresh.astype('u1')
    ret, contours, hierarchy = cv2.findContours(thresh_8bit, 1,  cv2.CHAIN_APPROX_SIMPLE)

    for contour in contours:
        cv2.drawContours(img_png, contours, -1, (255, 255, 0), 1)

    ax3.imshow(img_png, cmap='bone')
    fig.canvas.draw()

def ccomp():
    img_png = cv2.imread('img_8bit.png')
    thresh_8bit = thresh.astype('u1')
    ret, contours, hierarchy = cv2.findContours(thresh_8bit, 2, cv2.CHAIN_APPROX_SIMPLE)

    for contour in contours:
        cv2.drawContours(img_png, contours, -1, (255, 255, 0), 1)

    ax3.imshow(img_png, cmap='bone')
    fig.canvas.draw()

def tree():
    img_png = cv2.imread('img_8bit.png')
    thresh_8bit = thresh.astype('u1')
    ret, contours, hierarchy = cv2.findContours(thresh_8bit, 3,   cv2.CHAIN_APPROX_SIMPLE)

    for contour in contours:
        cv2.drawContours(img_png, contours, -1, (255, 255, 0), 1)

    ax3.imshow(img_png, cmap='bone')
    fig.canvas.draw()
ちょっと、長くなってしまいました。
今回はここまでとします。
次回、4つのボタンから最後に作成した関数に繋げて、領域抽出を行いその結果を表示するところまでやっていきたいと思います。
お疲れ様でした。
はじめに
前回、領域抽出の記事を書きましたが初めにやる処理、閾値設定がうまくいかないと抽出結果が思い通りにいかない結果となってしまいます。
ということで、今回はその閾値設定を可視化できるプログラムを組んでみたという記事です。
前回はjpg画像を使用しましたが、今回はDICOM画像を用いて行ってみたいと思います。
プログラムの流れ
今回の最終形はスライダーを用いて閾値設定をし視覚的に確認する事を目標にします。その為、元の画像と、閾値設定をした画像の2画像を表示し、片方の画像に閾値設定を適応することにします。どうせですので、閾値設定じゃない方の画像のWW,WLを調整できるようにスライダーを設定します。
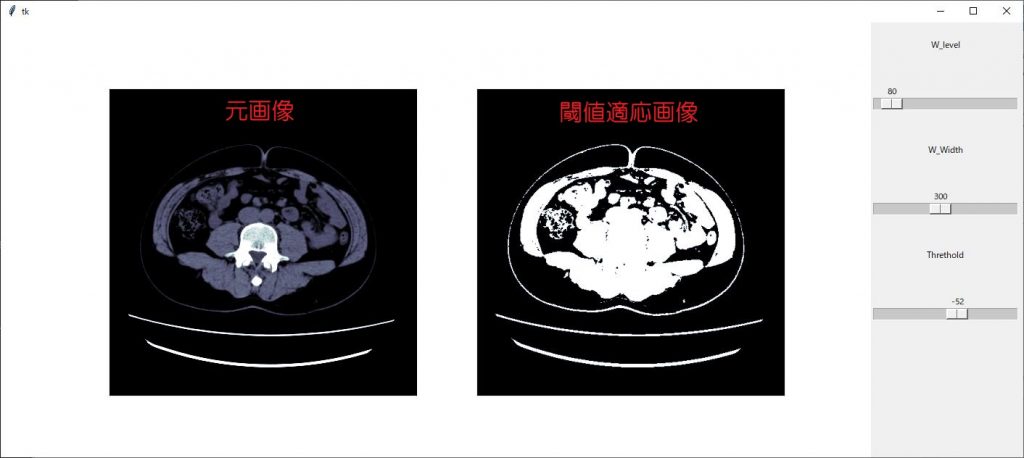
それでは、流れです
- DICOM画像を読み込み
- matplotlibの設定
- tkinterの設定(領域設定と、スライダー設定)
- スライダー変更時の動作設定
- 仕上げ
DICOM画像を読み込み
DICOM画像の読み込みですが、以前作成したモジュールを使用します。今回は1枚だけ読み込みをします。
import pydicom
import numpy as np
import fileselect as fs

def main():

    filename = fs.single_fileselect()
    dcm = pydicom.dcmread(filename)
    img_arr = dcm.pixel_array
    w_level = int(dcm[0x0028, 0x1050].value)
    w_width = int(dcm[0x0028, 0x1051].value)

if __name__ == "__main__":
    main()
画像を表示した際、適正条件で表示するためにウインドウレベルとウインドウ幅の情報もDICOMタグから取り込んでおきます。
matplotlibの設定
matplotlibの設定をします。設定項目は画像全てを表示する領域サイズの指定
画像領域の設定、軸の表示設定をします。
まずは、画像全てを表示する領域サイズの指定です。
fig = plt.figure(figsize=(12, 6))
表示領域は横12インチ、縦6インチとしました。
続いて、画像表示数はオリジナル画像と、閾値設定した画像の2枚を表示しますので2つ設定します。
ax1 = fig.add_subplot(1, 2, 1)
ax2 = fig.add_subplot(1, 2, 2)
そして、それぞれの画像に軸の表示はいらないので
ax1.axes.xaxis.set_visible(False), ax1.axes.yaxis.set_visible(False)
ax2.axes.xaxis.set_visible(False), ax2.axes.yaxis.set_visible(False)
で軸の表示を無くしておきます。
まずは、matplotlibをインポートしてからコードを足していきましょう。
import pydicom
import fileselect as fs
import matplotlib.pyplot as plt

def main():

    filename = fs.single_fileselect()
    dcm = pydicom.dcmread(filename)
    img_arr = dcm.pixel_array
    w_level = int(dcm[0x0028, 0x1050].value)
    w_width = int(dcm[0x0028, 0x1051].value)

    fig = plt.figure(figsize=(12, 6))
    ax1 = fig.add_subplot(1, 2, 1)
    ax2 = fig.add_subplot(1, 2, 2)

    ax1.axes.xaxis.set_visible(False), ax1.axes.yaxis.set_visible(False)
    ax2.axes.xaxis.set_visible(False), ax2.axes.yaxis.set_visible(False)

if __name__ == "__main__":
    main()
tkinterの設定(領域設定と、スライダー設定)
tkinterの領域設定は、先ほど設定したmatplotlibの領域と、この後設定するスライダーを合わせた領域を設定していきます。
root = tk.Tk()
root.geometry(“1410×600”)
まずは、tk.TK()で領域を作成します。その後、geometryで領域のサイズを指定しています。
Canvas = FigureCanvasTkAgg(fig, master=root)
Canvas.get_tk_widget().grid(row=0, column=0, rowspan=10)
FigureCanvasTkAgg(fig, master=root)でtkinter上にmatplotlibの画像の表示設定します。
ライブラリーのインポートを忘れないでくださいね。
from matplotlib.backends.backend_tkagg import FigureCanvasTkAgg
import pydicom
import numpy as np
import fileselect as fs
import matplotlib.pyplot as plt
from matplotlib.backends.backend_tkagg import FigureCanvasTkAgg

def main():

    filename = fs.single_fileselect()
    dcm = pydicom.dcmread(filename)
    img_arr = dcm.pixel_array
    w_level = int(dcm[0x0028, 0x1050].value)
    w_width = int(dcm[0x0028, 0x1051].value)

    fig = plt.figure(figsize=(12, 6))
    ax1 = fig.add_subplot(1, 2, 1)
    ax2 = fig.add_subplot(1, 2, 2)

    ax1.axes.xaxis.set_visible(False), ax1.axes.yaxis.set_visible(False)
    ax2.axes.xaxis.set_visible(False), ax2.axes.yaxis.set_visible(False)

    root = tk.Tk()
    root.geometry("1410x600")

    Canvas = FigureCanvasTkAgg(fig, master=root)
    Canvas.get_tk_widget().grid(row=0, column=0, rowspan=10)

if __name__ == "__main__":
    main()
続いてスライダー(tkinterではスケールと言います)の作成及び、設定をしたいと思います。
設定を始める前に知っておいてもらいたい事があります。
それは、スライダーという部品を構成するコードと、スライダーの値を格納するオブジェクトが必要だという事です。なので、まずは格納するオブジェクトを設定しておいて、その後スライダーの部品構成の中で値を格納するオブジェクトを指定しておく必要があります。
まず、オブジェクトを生成します。
オブジェクト名 = tk.IntVar()
IntVar()とは、整数値であるという事を宣言しています。
続いて、スライダー(スケール)部品の設定です。
変数名 = tk.Scale(オプション)
で設定を行います。オプションは以下となります。
| 第1引数 | 配置場所 |
| label | スケールのラベル |
| from_ | スケールの最小値 |
| to | スケールの最大値 |
| orient | 配置方向 tkinter.HORIZONTAL tkinter.VERTICAL(デフォルト) |
| length | スケールの長さです。 |
| showvalue | 値の表示、非表示 |
| variable | スケールの値を格納するインスタンス名 |
| command | 値が変更した時の実行関数 |
| resolution | 解像度 |
配置場所は、tkinterのcanvasとなりますのでrootとなります。
labelはウインドレベルと、ウインドウ幅、スレッショルドのスケールを作成しますのでそれぞれ、’Window Level ’、’Window Width’、’Threshold’としましょう。
スケールの最小値は、ウインドウ幅は0,ウインドウレベルとスレッショルドは画像信号値の最小値とします。
スケールの最大値は、ウインドウ幅には画像信号値の最小値から最大値までの半分、ウインドウレベル、スレッショルドは、画像信号値の最大値
orientは横方向としますので、tk.HORIZONTAL
長さは200ピクセルとします。
コマンドは、ウインドウ幅、ウインドウレベルで共有した関数windowを作成、スレッショルドは関数thresholdで作成します。
残りの引数の指定は省略してしまいましょう。
それでは、コードです。
まずはウインドウレベルから
var_scale_level = tk.IntVar()

level_sc = tk.Scale(root,
    label='Window Level',
    variable=var_scale_level,
    orient=tk.HORIZONTAL,
    length=200,
    from_= np.min(img_arr),
    to=np.max(img_arr),
    command=window)

level_sc.set(w_level)

level_sc.grid(row=1, column=1)
同様にウインドウ幅
var_scale_w_width = tk.IntVar()

w_width_sc = tk.Scale(root,
    label = 'Window Width',
    variable=var_scale_w_width,
    orient=tk.HORIZONTAL,
    length=200,
    from_=0,
    to=(np.max(img_arr) - np.min(img_arr))//2,
    command=window)

w_width_sc .set(w_width)

w_width_sc.grid(row=3, column=1)
スレッショルドは
thre = 0

var_thre = tk.IntVar()
thre_sc = tk.Scale(root,
label='Threshold',
variable=var_thre,
orient=tk.HORIZONTAL,
length=200,
from_=np.min(img_arr),
to=np.max(img_arr),
command=thresho)
thre_sc.set(thre)
thre_sc.grid(row=5, column=1)
ここまでのコードです
import pydicom
import fileselect as fs
import matplotlib.pyplot as plt
from matplotlib.backends.backend_tkagg import FigureCanvasTkAgg
import numpy as np

def main():

    filename = fs.single_fileselect()
    dcm = pydicom.dcmread(filename)
    img_arr = dcm.pixel_array
    w_level = int(dcm[0x0028, 0x1050].value)
    w_width = int(dcm[0x0028, 0x1051].value)

    fig = plt.figure(figsize=(12, 6))
    ax1 = fig.add_subplot(1, 2, 1)
    ax2 = fig.add_subplot(1, 2, 2)

    ax1.axes.xaxis.set_visible(False), ax1.axes.yaxis.set_visible(False)
    ax2.axes.xaxis.set_visible(False), ax2.axes.yaxis.set_visible(False)

    root = tk.Tk()
    root.geometry("1410x600")

    Canvas = FigureCanvasTkAgg(fig, master=root)
    Canvas.get_tk_widget().grid(row=0, column=0, rowspan=10)

    var_scale_level = tk.IntVar()
    level_sc = tk.Scale(root,
        label='Window Level',
        variable=var_scale_level,
        orient=tk.HORIZONTAL,
        length=200,
        from_= np.min(img_arr),
        to=np.max(img_arr),
        command=window)
    level_sc.set(w_level)
    level_sc.grid(row=1, column=1)

    var_scale_w_width = tk.IntVar()
    w_width_sc = tk.Scale(root,
        label = 'Window Width',
        variable=var_scale_w_width,
        orient=tk.HORIZONTAL,
        length=200,
        from_=0,
        to=(np.max(img_arr) - np.min(img_arr))//2,
        command=window)
        w_width_sc .set(w_width)
        w_width_sc.grid(row=3, column=1)


    var_thre = tk.IntVar()
    thre_sc = tk.Scale(root,
        label='Threshold',
        variable=var_thre,
        orient=tk.HORIZONTAL,
        length=200,
        from_=np.min(img_arr),
        to=np.max(img_arr),
        command=thresho)
        thre_sc.set(thre)
        thre_sc.grid(row=5, column=1)

if __name__ == "__main__":
    main()
スケール(スライダー)変更時の動作設定
スケールは3つ作成しましたが、関数はウインドウレベル、ウインドウ幅を変更した時の関数と、スレッショルドを変更した時の関数の2つを作成します。
まずは、ウインドウ幅、ウインドウレベルを変更した時の関数です。
matplotlibで画像を表示する際に、表示信号幅はvmin,vmaxで指定します。
ax1.imshow(img_arr, cmap=’bone’, vmin=ww_low, vmax=ww_high)
表示の最小値、最大値ですので、ウインドウレベルとウインドウ幅から最小値と最大値を計算しなければなりません。
それら計算は初めの画像表示時とウインドウレベル、ウインドウ幅のスケールを変更した時と何回も使用しますので、これも関数化しておきましょう。
関数名はlevel()として作成してみました。
def level():
    global ww_low, ww_high, w_level, w_width

    window_level, window_width = level_sc.get(), w_width_sc.get()

    ww_low = window_level - (window_width // 2)
    ww_high = window_level + (window_width // 2)
スケールの値をそれぞれ、window_level, window_widthとして取得します。その後、ww_low, ww_highとして計算します。
スケールの値はget()関数で取得します。上記コードでは1行で取得していますが
window_level = level_sc.get()
window_width = w_width_sc.get()
という感じです。
window_level, window_width, ww_low, ww_highは他の関数とも共有しますのでglobal宣言しておきます。(上記コード2行目)メイン関数の方でも同様にglobal宣言を足しておきましょう。
それでは、まずウインドウ幅、ウインドウレベルのスケールを変更した時の処理に入ります。
関数名はwindow()としました。
スケール指定される関数は、引数としてスケールの値が返されますので、関数の引き受ける引数としてself(名前はなんでもOK)を指定しておきます。
def window(self):
ってかんじです。
しかし、今回は2つのスケールから共通の関数として作成しているのでこの引数は使用しません。
まずは、この関数が呼び出された時に先ほど作成した関数level()でww_lowとww_highの値を計算させましょう。
level()
で、先ほどの関数を呼び出します。ただ、この関数内でもww_lowとww_highをglobal宣言しておかないと計算結果を使えませんので忘れずに宣言しておいてください。
後は、matplotlibの表示設定です。左側に元画像を表示するのでax1に設定します。
ax1.imshow(img_arr, cmap=’bone’, vmin=ww_low, vmax=ww_high)
続いて、figの更新するコードこれを忘れては表示が更新されませんので忘れずに。
fig.canvas.draw()
続いて閾値設定の関数です。関数名はthreshold()で作成します。
先ほど同様、スケールの値が引数と渡されますので
def threshold(self):
としておきます。
閾値設定は前々回の記事で書いていますのでご覧ください。
import pydicom
import fileselect as fs
import matplotlib.pyplot as plt
from matplotlib.backends.backend_tkagg import FigureCanvasTkAgg
import numpy as np

def level():
    global ww_low, ww_high, w_level, w_width

    window_level, window_width = level_sc.get(), w_width_sc.get()

    ww_low = window_level - (window_width // 2)
    ww_high = window_level + (window_width // 2)

def window(self):
    global ww_low, ww_high, img_arr, ax1

    level()

    ax1.imshow(img_arr, cmap='bone', vmin=ww_low, vmax=ww_high)
    fig.canvas.draw()

def thresho(self):
    global img_arr, ax2, fig

    ret, thresh = cv2.threshold(img_arr, int(self), 255, cv2.THRESH_BINARY)
    ax2.imshow(thresh, cmap='bone')

    fig.canvas.draw()

def main():
    global ww_low, ww_high, img_arr_copy, thre_sc, ax2, fig, img_arr, ax1, level_sc, w_width_sc, ww_low, ww_high, w_level, w_width

    filename = fs.single_fileselect()
    dcm = pydicom.dcmread(filename)
    img_arr = dcm.pixel_array
    w_level = int(dcm[0x0028,0x1050].value)
    w_width = int(dcm[0x0028, 0x1051].value)

    fig = plt.figure(figsize=(12, 6))
    ax1 = fig.add_subplot(1, 2, 1)
    ax2 = fig.add_subplot(1, 2, 2)

    ax1.axes.xaxis.set_visible(False), ax1.axes.yaxis.set_visible(False)
    ax2.axes.xaxis.set_visible(False), ax2.axes.yaxis.set_visible(False)

    root = tk.Tk()
    root.geometry("1410x600")

    Canvas = FigureCanvasTkAgg(fig, master=root)
    Canvas.get_tk_widget().grid(row=0, column=0, rowspan=10)

    var_scale_level = tk.IntVar()
    level_sc = tk.Scale(root,
        label='Window Level',
        variable=var_scale_level,
        orient=tk.HORIZONTAL,
        length=200,
        from_= np.min(img_arr),
        to=np.max(img_arr),
        command=window)
    level_sc.set(w_level)
    level_sc.grid(row=1, column=1)

    var_scale_w_width = tk.IntVar()
    w_width_sc = tk.Scale(root,
        label = 'Window Width',
        variable=var_scale_w_width,
        orient=tk.HORIZONTAL,
        length=200,
        from_=0,
        to=(np.max(img_arr) - np.min(img_arr))//2,
        command=window)
        w_width_sc .set(w_width)
        w_width_sc.grid(row=3, column=1)


    var_thre = tk.IntVar()
    thre_sc = tk.Scale(root,
        label='Threshold',
        variable=var_thre,
        orient=tk.HORIZONTAL,
        length=200,
        from_=np.min(img_arr),
        to=np.max(img_arr),
        command=thresho)
        thre_sc.set(thre)
        thre_sc.grid(row=5, column=1)

if __name__ == "__main__":
    main()
仕上げ
いよいよ、仕上げ作業です。
画像を読み込んだ際に先ほど作成した関数を呼び出さなければ画像表示できませんので、それを付け加えていきたいと思います。
上記コードmain関数の最後にウインドウ幅とウインドウレベルのスケールを変更した時の関数を呼び出しましょう。ただ、何か引数を与えないとエラーとなってしまいますので適当に1を渡しておきます。
同様に、閾値設定した画像を表示する関数を呼び出します。
window(1)
thresho(1)
これで完成となります。
完成コード
import tkinter as tk
import cv2
import matplotlib.pyplot as plt
from matplotlib.backends.backend_tkagg import FigureCanvasTkAgg
import numpy as np
import pydicom
import fileselect as fs


def level():
    global ww_low, ww_high, w_level, w_width

    window_level, window_width = level_sc.get(), w_width_sc.get()

    ww_low = window_level - (window_width // 2)
    ww_high = window_level + (window_width // 2)

def window(self):
    global ww_low, ww_high, img_arr, ax1

    level()

    ax1.imshow(img_arr, cmap='bone', vmin=ww_low, vmax=ww_high)
    fig.canvas.draw()

def thresho(self):
    global img_arr, ax2, fig

    ret, thresh = cv2.threshold(img_arr, int(self), 255, cv2.THRESH_BINARY)
    ax2.imshow(thresh, cmap='bone')

    fig.canvas.draw()


def main():
    global ww_low, ww_high, img_arr, thre_sc, ax2, fig,\
        img_arr, ax1, level_sc, w_width_sc, ww_low, ww_high, w_level, w_width


    filename = fs.single_fileselect()
    dcm = pydicom.dcmread(filename)
    img_arr = np.array(dcm.pixel_array)
    w_level = int(dcm[0x0028,0x1050].value)
    w_width = int(dcm[0x0028, 0x1051].value)

    fig = plt.figure(figsize=(12, 6))
    ax1 = fig.add_subplot(1, 2, 1)
    ax2 = fig.add_subplot(1, 2, 2)

    ax1.axes.xaxis.set_visible(False), ax1.axes.yaxis.set_visible(False)
    ax2.axes.xaxis.set_visible(False), ax2.axes.yaxis.set_visible(False)


    root = tk.Tk()
    root.geometry("1410x600")

    Canvas = FigureCanvasTkAgg(fig, master=root)
    Canvas.get_tk_widget().grid(row=0, column=0, rowspan=10)


    var_scale_level = tk.IntVar()
    level_sc = tk.Scale(root,
        label='Window Level',
        variable=var_scale_level,
        orient=tk.HORIZONTAL,
        length=200,
        from_= np.min(img_arr),
        to=np.max(img_arr),
        command=window)
    level_sc.set(w_level)
    level_sc.grid(row=1, column=1)

    var_scale_w_width = tk.IntVar()
    w_width_sc = tk.Scale(root,
        label = 'Window Width',
        variable=var_scale_w_width,
        orient=tk.HORIZONTAL,
        length=200,
        from_=0,
        to=(np.max(img_arr) - np.min(img_arr))//2,
        command=window)
    w_width_sc .set(w_width)
    w_width_sc.grid(row=3, column=1)


    thre = 0

    var_thre = tk.IntVar()
    thre_sc = tk.Scale(root,
        label='Threshold',
        variable=var_thre,
        orient=tk.HORIZONTAL,
        length=200,
        from_=np.min(img_arr),
        to=np.max(img_arr),
        command=thresho)
    thre_sc.set(thre)
    thre_sc.grid(row=5, column=1)

    window(1)
    thresho(1)

    root.mainloop()

if __name__ == "__main__":
    main()
最後に
いかがでしたか?きちんとコード動きましたか?
お疲れ様でした。
環境
- windows10
- python3.6.1
- Anaconda custom(64-bit)
- PyCharm2020.2(Communication Edition)
はじめに
こんにちは。でめきんです。
前々回、「tkinterでmatplotlibの画像を表示」という記事を書きましたが、今回は「openCVの画像を表示する」をやってみたいと思います。
openCVは画像処理や、動画を処理するライブラリーとなっていますので、tkinter上にopenCVで取り込んだ画像を表示できれば、tkinterのGUI機能であるボタン等に画像処理の機能を実装することが出来るようになります。
いわゆる、画像処理ソフト的なものを作成することが出来るかもしれません。
一見、openCVで取り込んだ画像をtkinterに表示ととらえられるかもしれませんが、実際はopenCVで取り込んだ画像をmatplotlibで表示。それをtkinter上に表示するという流れになります。
openCV自体にtkinterのGUI上に画像を表示させる機能は無いみたいです。ネット上ではopenCVで取り込んだ画像をPILLOWを用いてtkinter上に表示する記事が多いですが、我々診療放射線技師はmatplotlibを用いて表示した方が何かと便利だと思いますので今回はmatplotlibを用いた方法を紹介します。
流れ
前々回の記事での流れと同様となります。
- 画像をopenCVで読み込む
- matplotlibの表示設定を行う
- tkinterのcanvas設定を行う
注意点
今回注意しなければならない点が1点あります。
それは、openCVで取り込んだ画像はBlue,Green,RedのBGR順での色情報となっています。しかし、matplotlibやPILLOWではRed,Green,BlueのRGB順で色情報が入っていますので、その順番を変えてあげる必要があります。
ちなみに、入れ替えずに画像表示をすると以下の画像となります。
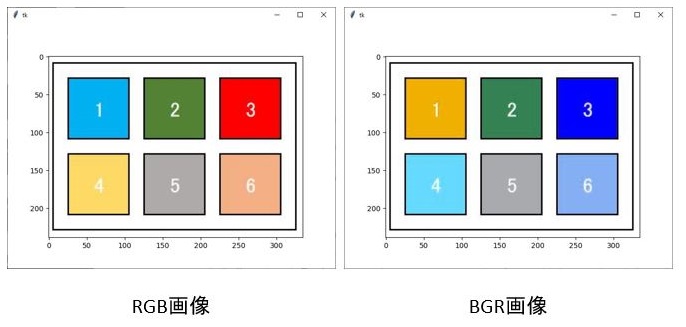
上の図を見てみると、「3」の背景色左のRGB画像では赤ですが、右のBGR画像では青に入れ替わっています。「1」と「4」の背景色も入れ替わっていますね。
それでは、どのように変更するかというと
img_rgb = cv2.cvtColor(img_bgr, cv2.COLOR_BGR2RGB)
cv2.cvtColorといったコードを用いて、BGRからRGBに変更することができます。
ちなみに、BGR2RGBの2はタイプミスではありませんのであしからず。toの意味です。ちなみにグレイスケールに変更する場合はBGR2GLAYでできます。
コード
完成コードは以下となります。
import tkinter
import cv2
import matplotlib.pyplot as plt
from matplotlib.backends.backend_tkagg import FigureCanvasTkAgg

root = tkinter.Tk()

img_bgr = cv2.imread("img.JPG")
img_rgb = cv2.cvtColor(img_bgr, cv2.COLOR_BGR2RGB) # BGRからRGBに変換

fig = plt.figure()
ax =fig.add_subplot()
ax = img_rgb

plt.imshow(img_rgb)

Canvas = FigureCanvasTkAgg(fig, master=root)
Canvas.get_tk_widget().grid(row=0, column=0)
root.mainloop()
最後に
いかがでしたか?
次回は、openCVの機能をtkinterのボタンウイジェットに組み込むという事をやってみたいと思います。
お疲れ様でした。
The post tkinterでopenCVの画像を表示 first appeared on 診療放射線技師がPythonをはじめました。.]]>はじめに
こんにちは、でめきんです。
今回はopenCVを使って輪郭を識別することをやってみたいと思います。
今回の輪郭抽出はDICOM画像ではなく、以下のjpg画像を用います。

輪郭抽出の手順
- 画像の読み込み
- 画像の2値化
- 閾値設定を行う
- 領域を抽出
- 領域を重ね合わせ
- 画像表示
画像の読み込み
openCVの画像読み込みは
img = cv2.imread(“img.JPG”)
画像の2値化 cv2.cvtColor
領域抽出をする際に、色情報があると領域の境が曖昧になってしまいますのでグレイスケールに変換します。
img_gray = cv2.cvtColor(img, cv2.COLOR_BGR2GRAY)
閾値設定 cv2.threshold
閾値設定をして画像の領域の調整します。
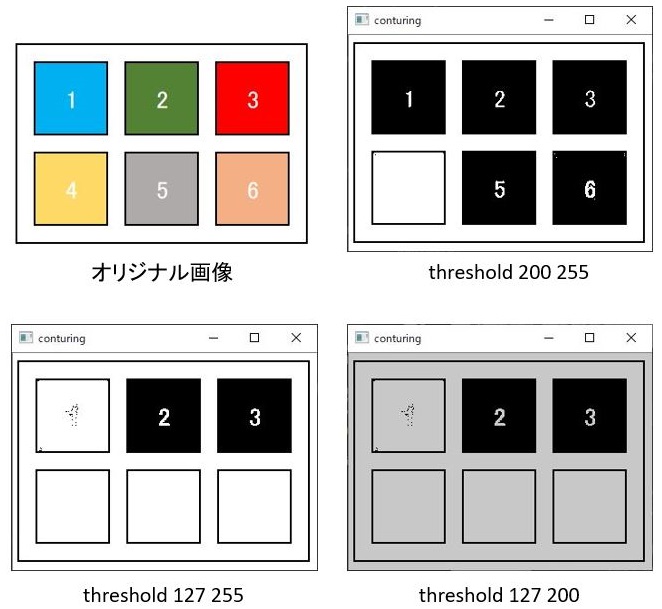
ret, thresh = cv2.threshold(img_gray,127,255,cv2.THRESH_BINARY)
閾値設定とは、第2引数(上のコードでは’127’)よりも大きい値が第3引数の値(255)に第2引数よりも小さい数字は0に置き換わります。
領域を抽出 cv2.findContours
いよいよ本題に入っていきます。
領域の抽出は一度画像上のすべての領域を検出します。その後、表示の際に大きさであったり、輪郭線の長さであったりで抽出条件を指定して表示します。
(私は、初めから抽出条件を指定して領域を探し出すものと勘違いしていたので理解するのに苦労しました・・・・そんな人はいないかな・・・・)
まずは、領域抽出
ret, contours, hierarchy = cv2.findContours(thresh, cv2.RETR_TREE, cv2.CHAIN_APPROX_SIMPLE)
第1引数は画像を指し、第2引数に抽出方法、第3引数として近似手法を指定します。
抽出方法
| cv2.RETR_EXTERNAL | 輪郭のうち、最も外側のみ抽出 | |
| cv2.RETR_LIST | 全ての輪郭を抽出 | |
| cv2.RETR_CCOMP | 全ての輪郭を2レベルの階層に分けて出力 | |
| cv2.RETR_TREE | 抽出した内側の輪郭も抽出 |
近似方法
| cv2.CHAIN_APPROX_NON | 輪郭上の全点をの情報を保持 |
| cv2.CHAIN_APPROX_SIMPLE | 輪郭を圧縮し情報を保持 |
領域を重ね合わせ cv2.drawContours
領域の抽出が済みましたら、今度は元画像との重ね合わせとなります。
cv2.drawContours
cv2.drawContours(img, contours, 3, color, 2)
| 第1引数 | 重ね合わせる画像 |
| 第2引数 | 領域抽出したリスト |
| 第3引数 | リストの中の何番目を表示するか (すべてを表示する場合は-1を指定します。) |
| 第4引数 | 線のカラー |
| 第5引数 | 線の太さ |
画像表示
cv2.imshow(‘conturing’,img)
と忘れてはいけない
cv2.waitKey(0)
cv2.destroyAllWindows()
コード
import cv2

img = cv2.imread("img.JPG")
img_gray = cv2.cvtColor(img, cv2.COLOR_BGR2GRAY)

ret, thresh = cv2.threshold(img_gray,127,255,cv2.THRESH_BINARY)
ret, contours, hierarchy = cv2.findContours(thresh, cv2.RETR_TREE, cv2.CHAIN_APPROX_SIMPLE)

color = (255, 255, 0)

for contour in contours:

    # 境界の描画 ( img データに contours データをマージ )
    cv2.drawContours(img, contours, -1, color, 2)

cv2.imshow('conturing',img)

cv2.waitKey(0)
cv2.destroyAllWindows()

最後に
いかがでしたか?
今回は概要となりますが、今後機会があれば、もう少し詳しく記事にしていきたいと思います。
お疲れ様でした。
The post openCVで輪郭抽出をやってみた first appeared on 診療放射線技師がPythonをはじめました。.]]>大体の方がpythonをインストールする時、anacondaを使ってインストールされていると思うのですがその際、OpenCVや、pydicomはパッケージの中に含まれておらず、自分でインストールしなければなりません。
その方法を今回は紹介したいと思います。
OpenCVのインストール
まずはOpenCVのインストールです。
コマンドプロンプトを立ち上げます。画面左下ウインドウズマークの右側の検索ボックスに”cmd”と打ち込むと以下のようになりますので”コマンドプロンプト”を選択してください。

そこに
pip install opencv-python
と打ち込みます。少し待つとインストールが始まります。この待ち時間、少し長いことがあります。気長に待ちましょう。
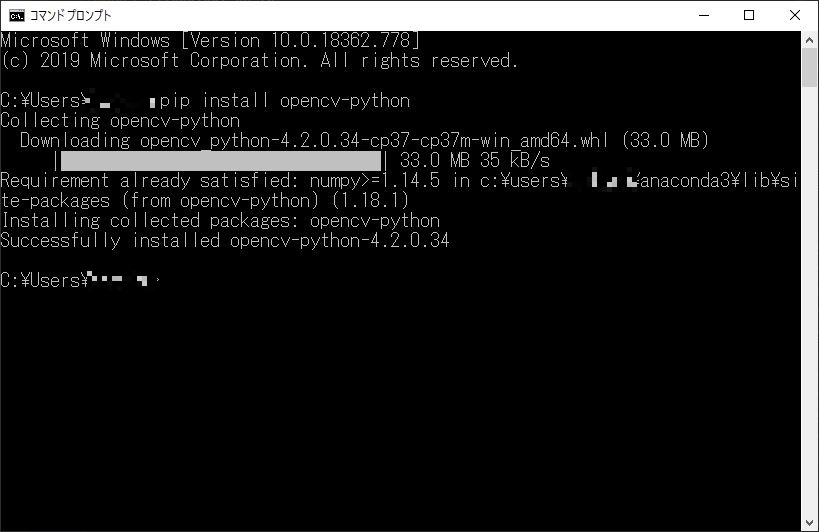
一番下に
c:\Users\ユーザー名>
と表示されればインストール完了です。
pydicomのインストール
OpenCV同様にpydicomのインストールをしていきましょう。
pydicom、以前はdicomというモジュール名だったんです。(どうでもいい話です。)
OpenCVの時と同様にコマンドプロンプトを立ち上げて以下を打ち込みます。
pip install pydicom
これで、少し待っていればインストール完了です。
以上、OpenCVとpydicomのインストール方法でした。
環境
- windows10
- python3.6.1
- Anaconda custom(64-bit)
- PyCharm2020.2(Communication Edition)
手順
手順としては、
- DICOM画像を読み込み
- ピクセルデータを配列として読み込み
- ww、wlで最適な条件に合わせる
- その配列をww、wlの範囲に落とし込む
- 汎用画像として保存
の手順となります。
ただ、前回までの記事で1~4までの作業は完了しいるので残り5番の作業となります。(前回のコードは下のリンクから)
それでは、5番の作業をさらに細かく分けていきましょう。
- 何をきっかけに画像保存をするか?
- 保存先の指定は?
- ファイル名は?
- 画像形式は何にするか?
- コードを作成
それでは、それぞれ決めていきましょう。
何をきっかけに画像保存をする?
まずは、何をきっかけに画像保存をするか?
せっかく前回マウスイベントで作業をしたので今回もマウスイベントで画像保存する方法をやっていきましょう。
右クリックを押した時に、画像保存ができるようにします。(過去のマウスイベントの記事はこちら)
右クリックを押した時の指定は
if event == cv2.EVENT_RBUTTONDOWN:
でできます。
前回のマウスホイールを回した時の関数の後に記載します。
インデントの位置は
if event == cv2.EVENT_MOUSEWHEEL:
と同じ位置にします。
保存先の指定は?
新しく作成する画像の保存先の指定はどのようにするか?
それはユーザーが指定できるように組みたいと思います。
右クリックを押した時に、ファイルダイアログが開いて画像の保存フォルダを指定できるようにします。
これも以前、記事で書いたフォルダ選択でやってみたいと思います。
以前の記事では、フォルダ内のファイル全部を選択する形となっていたので少しそこを修正、追加して使いたいと思います。前回のコードは以下となります。
# -*- coding: utf-8 -*-

import tkinter
from tkinter import filedialog as tkFileDialog
import glob

#ファイルを一つ選択::::::::::::::::::::::::::::::::::::::::::::::::::::::::::::::::::::::
def single_fileselect():
    root = tkinter.Tk()
    root.withdraw()

    fTyp = [('', '*')]

    iDir = 'C:/Desktop'

    filename = tkFileDialog.askopenfilename(filetypes=fTyp, initialdir=iDir)
    return filename

#ファイルを複数選択:::::::::::::::::::::::::::::::::::::::::::::::::::::::::::::::::::::::
def multi_fileselect():
    root = tkinter.Tk()
    root.withdraw()

    fTyp = [('', '*')]
    iDir = 'C:/Desktop'

    filenames = tkFileDialog.askopenfilenames(filetypes=fTyp, initialdir=iDir)

    return filenames

#ファイルをフォルダで一括選択:::::::::::::::::::::::::::::::::::::::::::::::::::::::::::::
def folder_fileselect():
    root = tkinter.Tk()
    root.withdraw()

    iDir = 'C:/Desktop'

    dirname = tkFileDialog.askdirectory(initialdir=iDir)

    filenames = glob.glob(dirname +"/*")
    return filenames
フォルダだけ選択できればいいので
#ファイルをフォルダで一括選択の下から2段目
filenames = glob.glob(dirname +”/*”)
を削除すればフォルダのパスのみ取得できますので
関数名 folder として作成してしまいましょう
# -*- coding: utf-8 -*-

import tkinter
from tkinter import filedialog as tkFileDialog
import glob

#ファイルを一つ選択::::::::::::::::::::::::::::::::::::::::::::::::::::::::::::::::::::::
def single_fileselect():
    root = tkinter.Tk()
    root.withdraw()

    fTyp = [('', '*')]

    iDir = 'C:/Desktop'

    filename = tkFileDialog.askopenfilename(filetypes=fTyp, initialdir=iDir)
    return filename

#ファイルを複数選択:::::::::::::::::::::::::::::::::::::::::::::::::::::::::::::::::::::::
def multi_fileselect():
    root = tkinter.Tk()
    root.withdraw()

    fTyp = [('', '*')]
    iDir = 'C:/Desktop'

    filenames = tkFileDialog.askopenfilenames(filetypes=fTyp, initialdir=iDir)

    return filenames

#ファイルをフォルダで一括選択:::::::::::::::::::::::::::::::::::::::::::::::::::::::::::::
def folder_fileselect():
    root = tkinter.Tk()
    root.withdraw()

    iDir = 'C:/Desktop'

    dirname = tkFileDialog.askdirectory(initialdir=iDir)

    filenames = glob.glob(dirname +"/*")
    return filenames

#フォルダを選択:::::::::::::::::::::::::::::::::::::::::::::::::::::::::::::
def folder():
    root = tkinter.Tk()
    root.withdraw()

    iDir = 'C:/Desktop'

    dirname = tkFileDialog.askdirectory(initialdir=iDir)

    return filenames
この関数を呼び出すことでフォルダの指定ができます。
フォルダパスはfolという変数名で受け取るようにします。
if event == cv2.EVENT_RBUTTONDOWN:
の後に
fol = fs.folder()
とすることでfolの変数内に指定したフォルダパスを入れることができます。
ファイル名は?
ファイル名ですが、DICOM画像と同じ名前で保存する方法としましょう。
ファイル選択したパスからファイル名だけを抽出する方法は以下の記事に記載してあります。
.rfind(“/”)
で最後から数えて “/” が何文字目にあるかを調べます。
そしてそのファイルパスから、その文字分だけ切り抜いてあげ、先ほど選択したフォルダの後ろにつけてあげればいいわけです。
変数couとして画像ファイル名の前にある”/”までの文字数を入れます。
cou = filenames[i].rfind(“/”)
(なお、[i]は後でfor文の中でこのコードを使うので入れています。)
その数字文ファイルパスから抜き出せばいいので
filenames[i][cou:]
これで、ファイル名の抜き出しが完了です。
画像形式は何にするか?
画像形式は、jpg,png,bmp,tiffどの形式にするか決まったら、保存する時、パスの最後に付けてあげればいいだけです。
なので
“.jpg” “.png” “.bmp” “.tiff”
これだけで、画像形式の指定が終わりです。
画像保存
次は、画像を保存していく工程になります。
cv2.imwrite(ファイルパス,データ)
のコードで行います。
まずは保存先のファイルパスを作成します。
ファイルパスは、画像保存のフォルダにファイル名、拡張子を付けて作成します。
保存フォルダはfolの変数名で取得しましたね。
次にファイル名は
cou = filenames[i].rfind(“/”)
filenames[i][cou:]
の2文で抜き出しができました。
画像形式はjpegとしますと”.jpg”となりますので
ファイルパスfnameは
fname = fol + filenames[i][cou:] + “.jpg”
となります。
画像データはdcm_copyとなります。
後はfor文の中に上のコードを入れてあげればいいので、マウスイベントの文も合わせると
if event == cv2.EVENT_RBUTTONDOWN:
	fol = fs.folder()

	for i in range(len(dcm_copy)):

		cou = filenames[i].rfind("/")
		fname = fol + filenames[i][cou:] + ".jpg"

		cv2.imwrite(fname,dcm_copy[i])
これでコードは完成しました。
ただ、ここで問題があります。
今作成しているコードはマウスイベントの関数内でありますので、関数外で宣言しているfilenamesおよび、画像表示に作成した配列dcm_copyは使用できません。なのでこれを使うにはglobalで宣言しておかなければなりません。なので、マウスイベントの関数を宣言した直下に宣言を追加します。前回のコードでgという変数を宣言したと思いますが、その後に追加します。
def onMouse(event, x, y, flag, params):
global g,dcm_copy,filenames
これで、関数外で宣言していたfilenamesおよび、dcm_copyが使えるようになりました。
完成したコード
# coding: UTF-8
import fileselect as fs   #ファイルパス取得のモジュールをインポート
import numpy as np
import pydicom
import math
import copy
import cv2

def onMouse(event, x, y, flag, params):
    global g,dcm_copy,filenames
    g = params

    if event == cv2.EVENT_MOUSEWHEEL:
        if flag > 0:
            g -= 1
        elif flag < 0:
            g += 1

        if g <= 0:
            g = 0
        elif g >= len(filenames)-1:
            g = len(filenames)-1

    if event == cv2.EVENT_RBUTTONDOWN:
        fol = fs.folder()

        for i in range(len(dcm_copy)):

            cou = filenames[i].rfind("/")
            fname = fol + filenames[i][cou:] + ".jpg"

            cv2.imwrite(fname,dcm_copy[i])

def make_LUT(val):
    global lookup_tbl, dcm_copy
    wl = cv2.getTrackbarPos('WL', 'dcm_image')
    ww = cv2.getTrackbarPos('WW', 'dcm_image')

    ww_low = wl - ww // 2
    ww_high = wl + ww // 2
    lookup_tbl[0:ww_low] = 0
    lookup_tbl[ww_high:maxvalue] = 255
    for i in range(ww_low, ww_high, 1):
        lookup_tbl[i] = math.ceil((i - ww_low) * (256 / (ww_high - ww_low)))

    dcm_copy = lookup_tbl[dcm_main]

    dcm_copy =cv2.convertScaleAbs(dcm_copy, alpha=255/dcm_copy.max())

filenames = fs.multi_files()

dcm = pydicom.dcmread(filenames[0])
row,columns = dcm.pixel_array.shape[0],dcm.pixel_array.shape[1]

dcm_copy = np.zeros((len(filenames), row, columns),dtype = 'int16')

for i in range(len(filenames)):
    dcm = pydicom.dcmread(filenames[i])
    dcm_arr = dcm.pixel_array
    dcm_copy[i] = dcm_arr

dcm_main = copy.deepcopy(dcm_copy)

cv2.namedWindow('dcm_image',cv2.WINDOW_NORMAL)

maxvalue = dcm_copy.max()
lookup_tbl = np.zeros(maxvalue+1, dtype='int16')

cv2.createTrackbar("WL", "dcm_image", (maxvalue // 2), maxvalue, make_LUT)
cv2.createTrackbar("WW", "dcm_image", (maxvalue // 4), maxvalue, make_LUT)

make_LUT(0)
g = 0

while 1:
    params = g
    cv2.setMouseCallback('dcm_image', onMouse, params)
    cv2.imshow('dcm_image', dcm_copy[g])

    k = cv2.waitKey(1)
    if k == ord('q'):
        break
となります。いかがでしたか?
お疲れ様でした。
環境
- windows10
- python3.6.1
- Anaconda custom(64-bit)
- PyCharm2020.2(Communication Edition)
マウスホイールを使った画像変更
まず、「MRI画像をスライダーを使ってウインドウ調整」からマウスホイールのイベントを持ってきます。
def onMouse(event, x, y, flag, params):

    if event == cv2.EVENT_MOUSEWHEEL:  # ホイールを回したときの動作
        print('マウスホイール' + str(g))
        if flag > 0:       #もしflagが正の数だったら画像番号gを1引く
            g -= 1         # -= とはgの数から1を引いた数をiに代入すること
        elif flag < 0:     #もしflagが負の数だったら画像番号gを1足す
            g += 1         # += とはgの数から1を引いた数をgに代入すること

        if g <= 0:         #もし、gが0より小さかったら
            g = 0         #iは0
        elif g >= len(filenames)-1:  #もし、gが要素数以上だったら
            g = len(filenames)-1    #要素数より1少ない数に
これをまず、前回のコードに貼り付けていきます。
なお、前回変数はiを用いていましたがfor文でiを使っているので明確に区別するため今回はgという変数を指定しています。
前回のコードにマウスイベントのコードを張り付け
import fileselect as fs   #ファイルパス取得のモジュールをインポート
import numpy as np
import pydicom
import math
import copy
import cv2

def onMouse(event, x, y, flag, params):

    if event == cv2.EVENT_MOUSEWHEEL:  # ホイールを回したときの動作
        print('マウスホイール' + str(g))
        if flag > 0:
            g -= 1
        elif flag < 0:
            g += 1

        if g <= 0:
            g = 0
        elif g >= len(filenames)-1:
            g = len(filenames)-1

def make_LUT(val):
    pass #何もしない

filenames = fs.multi_fileselect

dcm = pydicom.dcmread(filenames[0])
row,columns = dcm.pixel_array.shape[0],dcm.pixel_array.shape[1]

dcm_copy = np.zeros((len(filenames), row, columns),dtype = 'int16')

for i in range(len(filenames)):
    dcm = pydicom.dcmread(filenames[i])
    dcm_arr = dcm.pixel_array
    dcm_copy[i] = dcm_arr

dcm_main = copy.deepcopy(dcm_copy)

cv2.namedWindow('dcm_image',cv2.WINDOW_NORMAL)

maxvalue = dcm_copy.max()
lookup_tbl = np.zeros(maxvalue+1, dtype='int16')

cv2.createTrackbar("WL", "dcm_image", (maxvalue // 2), maxvalue, make_LUT)
cv2.createTrackbar("WW", "dcm_image", (maxvalue // 4), maxvalue, make_LUT)

while 1:
    wl = cv2.getTrackbarPos('WL', 'dcm_image')
    ww = cv2.getTrackbarPos('WW', 'dcm_image')

    ww_low = wl - ww // 2
    ww_high = wl + ww // 2
    lookup_tbl[0:ww_low] = 0
    lookup_tbl[ww_high:maxvalue] = 255
    for i in range(ww_low, ww_high, 1):
        lookup_tbl[i] = math.ceil((i - ww_low) * (256 / (ww_high - ww_low)))

    dcm_copy = lookup_tbl[dcm_main]

    dcm_copy =cv2.convertScaleAbs(dcm_copy, alpha=255/dcm_copy.max())
    cv2.imshow('dcm_image', dcm_copy[0])

    k = cv2.waitKey(1)
    if k == ord('q'):
        break
修正箇所
機能分散
以前は、while分を用いて画像表示をずっとループさせることで対処していました。しかし、そのループの中でww,wlの値を取得し、ルックアップテーブルの更新、それを画像配列に適応といった作業をしており非常に非効率的ですので、そこを修正していきたと思います。
まず、ルックアップテーブルの作成から画像配列への適応まではww,wlのスライダーを変更した時のみやればいい作業なので49~61行目までを24行目にある関数make_LUTの関数に入れてしまいましょう。passの一文は削除してください。
ちょっと話が脱線しますが、初めの表に以下の一文を追加しておいてください。
#coding: UTF-8
これが無いとprintのコードで日本語が使えません。。。。
# coding: UTF-8
import fileselect as fs
import numpy as np
import pydicom
import math
import copy
import cv2

def onMouse(event, x, y, flag, params):

    if event == cv2.EVENT_MOUSEWHEEL:
        if flag > 0:
            g -= 1
        elif flag < 0:
            g += 1

        if g <= 0:
            g = 0
        elif g >= len(filenames)-1:
            g = len(filenames)-1

def make_LUT(val):

    wl = cv2.getTrackbarPos('WL', 'dcm_image')
    ww = cv2.getTrackbarPos('WW', 'dcm_image')

    ww_low = wl - ww // 2
    ww_high = wl + ww // 2
    lookup_tbl[0:ww_low] = 0
    lookup_tbl[ww_high:maxvalue] = 255
    for i in range(ww_low, ww_high, 1):
        lookup_tbl[i] = math.ceil((i - ww_low) * (256 / (ww_high - ww_low)))

    dcm_copy = lookup_tbl[dcm_main]

    dcm_copy =cv2.convertScaleAbs(dcm_copy, alpha=255/dcm_copy.max())

filenames = fs.multi_fileselect

dcm = pydicom.dcmread(filenames[0])
row,columns = dcm.pixel_array.shape[0],dcm.pixel_array.shape[1]

dcm_copy = np.zeros((len(filenames), row, columns),dtype = 'int16')

for i in range(len(filenames)):
    dcm = pydicom.dcmread(filenames[i])
    dcm_arr = dcm.pixel_array
    dcm_copy[i] = dcm_arr

dcm_main = copy.deepcopy(dcm_copy)

cv2.namedWindow('dcm_image',cv2.WINDOW_NORMAL)

maxvalue = dcm_copy.max()
lookup_tbl = np.zeros(maxvalue+1, dtype='int16')

cv2.createTrackbar("WL", "dcm_image", (maxvalue // 2), maxvalue, make_LUT)
cv2.createTrackbar("WW", "dcm_image", (maxvalue // 4), maxvalue, make_LUT)

while 1:

    cv2.imshow('dcm_image', dcm_copy[0])

    k = cv2.waitKey(1)
    if k == ord('q'):
        break
これで、機能の分散はできました。
プログラムを繋げていく
しかし、このままでは画像表示ができません。DICOM画像は画素値がjpegやping画像のように256階調で収まっていないので、それをwwの範囲を256階調に当てはめていく必要があります。その処理が前回のコードでは画像表示の直前にあったのですが、今回はmake_LUTの関数の中に入っていますので、画像選択の後に一度make_LUTの関数を走らなければなりません。
関数を呼び出す場所はwhile文の前で、トラックバーの設定が終わった60行目にしましょう。
make_LUTの関数はトラックバーを変更した時の関数でトラックバーの値を引数としてmake_LUTに渡します。しかし、make_LUTの関数内ではcv2.getTrackbarPosで値を取得しているので正直、この引数はあまり意味がありません。
なので、引数は適当に数字の’0’を入れておきます。
60行目に以下の一文を挿入してください。
make_LUT(0)
これで、ルックアップテーブルの作成と、それを適応した画像配列への適応への流れを作る事ができました。
ここで作成した画像配列を表示すればいいことになります。
配列のグローバル化
しかし、ここでまた問題があります。
make_LUTの関数内ではlookup_tblとdcm_copyの配列を使います。しかし、make_LUTの関数は引数を一つしか受けないという事です。
先ほど60行目に記入した関数を指定する場合は、いくらでも引数を指定できます。しかし、今回はスライダーの設定(58~59行目)と共有しています。そちらの方は引数を幾つも指定することはできません。
その為、関数外の変数、配列を使えるようにしなくてはいけません。
以下を見てください。
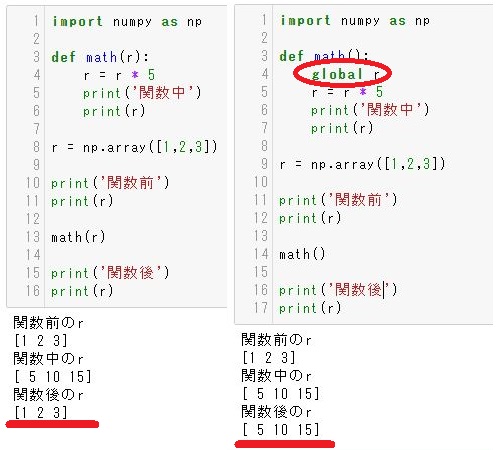
左側のコードでは、関数内で配列を5倍していますが、関数から戻って来ると値が元に戻ってしまっています。
関数内で更新したものは関数内でしか適応されません。(retuenで返せば別です)
右側のコードを見てください。関数内で’global 配列名(変数名)’とすることで引数として渡さなくても関数外の配列(変数)を使うことができるようになります。また、関数内で処理した結果も関数外に反映されます。
これを用いて画像表示用の配列を指定してあげましょう。
関数make_LUTの中で使いたい配列はlookup_tblとdcm_copyですので
24行目に
global lookup_tbl,dcm_copy
を追加します。この一文で配列lookup_tblとdcm_copyを使うことができるようになり、更新した結果も関数外で利用することができるようになりました。
いかがでしょうか?これで画像表示までできました。スライダーもきちんと機能していますよね?
しかし、まだマウスホイールで画像変更はできていません、次にそれを付け加えていきたいと思います。
マウスイベントの追加
まず、マウスイベント内で使っている変数gの初期化をしておかなくてはなりません。画像は選択した初めの画像を表示したいので0としておきましょう。
while分の中で宣言してしまうと常に0が代入されてしまうのでwhile文の直前で宣言しておきましょう
g = 0
の一文をwhile文の前に入れておきます。
そして、マウスホイール動かした際の動作は、画像を切り替えて表示する事なのでマウスイベントを呼び出す関数はwhile文の中に書きます。
そして、マウスイベントに引き渡す変数はparamsの中にまとめて指定します。
今回はgという変数しかないので
(詳しくは過去の記事「マウスを使って画像を切り替える」を見てください。)
params = g
そしてマウスイベントを呼び出す
cv2.setMouseCallback(‘dcm_image’, onMouse, params)
最後に、マウスイベント関数内にparamsの中にgという変数が入っていますよ!とマウスイベントの中で示してあげる必要があります。
また、このマウスイベントで変更したgは関数外で使用しますのでグローバル化しておきます。
global g
そしてその後に
g = params
を書いてあげましょう。
いよいよ完成しました。
動かしてみましょう。
あれ、画像が変わらない。。。。
忘れていました。
cv2.imshow(‘dcm_image’, dcm_copy[0])
dcm_copy[0] を dcm_copy[g]
0 ⇒ g
に変更をお忘れなく。
お疲れ様でした。
完成したコード
# coding: UTF-8
import fileselect as fs   #ファイルパス取得のモジュールをインポート
import numpy as np
import pydicom
import math
import copy
import cv2

def onMouse(event, x, y, flag, params):
    global g,dcm_copy,filenames
    g = params

    if event == cv2.EVENT_MOUSEWHEEL:
        if flag > 0:
            g -= 1
        elif flag < 0:
            g += 1

        if g <= 0:
            g = 0
        elif g >= len(filenames)-1:
            g = len(filenames)-1

def make_LUT(val):
    global lookup_tbl, dcm_copy
    wl = cv2.getTrackbarPos('WL', 'dcm_image')
    ww = cv2.getTrackbarPos('WW', 'dcm_image')

    ww_low = wl - ww // 2
    ww_high = wl + ww // 2
    lookup_tbl[0:ww_low] = 0
    lookup_tbl[ww_high:maxvalue] = 255
    for i in range(ww_low, ww_high, 1):
        lookup_tbl[i] = math.ceil((i - ww_low) * (256 / (ww_high - ww_low)))

    dcm_copy = lookup_tbl[dcm_main]

    dcm_copy =cv2.convertScaleAbs(dcm_copy, alpha=255/dcm_copy.max())

filenames = fs.multi_files()

dcm = pydicom.dcmread(filenames[0])
row,columns = dcm.pixel_array.shape[0],dcm.pixel_array.shape[1]

dcm_copy = np.zeros((len(filenames), row, columns),dtype = 'int16')

for i in range(len(filenames)):
    dcm = pydicom.dcmread(filenames[i])
    dcm_arr = dcm.pixel_array
    dcm_copy[i] = dcm_arr

dcm_main = copy.deepcopy(dcm_copy)

cv2.namedWindow('dcm_image',cv2.WINDOW_NORMAL)

maxvalue = dcm_copy.max()
lookup_tbl = np.zeros(maxvalue+1, dtype='int16')

cv2.createTrackbar("WL", "dcm_image", (maxvalue // 2), maxvalue, make_LUT)
cv2.createTrackbar("WW", "dcm_image", (maxvalue // 4), maxvalue, make_LUT)

make_LUT(0)
g = 0

while 1:
    params = g
    cv2.setMouseCallback('dcm_image', onMouse, params)
    cv2.imshow('dcm_image', dcm_copy[g])

    k = cv2.waitKey(1)
    if k == ord('q'):
        break
次回はトラックバーで画像調整したものをjpgやpngといった汎用画像に保存する方法をやっていきたいと思います。
環境
- windows10
- python3.6.1
- Anaconda custom(64-bit)
- PyCharm2020.2(Communication Edition)
