例えば、前立腺を抽出するセグメンテーションをしたい場合は、学習画像として、元画像と、前立腺だけを抽出した(下の画像右側)のような画像を作成しなければいけません。

ワークステーションを使えばできるのですが、業務終了後に職場に残ってこの作業、やりたくないですよね。自分なら、家で酒でも飲みながら音楽をかけて作業。を望みます。
なので、今回は、この画像を作成するコードを組んでいきます。
コード
最終的なコードは以下となります。
import numpy as np
import cv2
import pydicom
import matplotlib.pyplot as plt
from matplotlib.patches import Circle

def on_motion(event):
    global contour, fig, ax1

    if event.button == 1 :
        contour.append([int(event.xdata), int(event.ydata)])
        ax1.add_patch(Circle((event.xdata, event.ydata), 0.1, color='r'))
        fig.canvas.draw()


def on_button_release(event):
    global contour, mask, ax2

    cv2.fillConvexPoly(mask, np.array(contour), color=255, lineType=cv2.LINE_AA)

    ax2.imshow(mask, cmap='bone')
    fig.canvas.draw()


def main():
    global contour, fig, ax1, ax2, mask

    dcm = pydicom.dcmread('009_IMG11')
    img = dcm.pixel_array

    mask = np.zeros_like(img, dtype=np.uint8)


    ww, wl = dcm[0x0028, 0x1051].value, dcm[0x0028, 0x1050].value
    ww_l, ww_h = wl - ww // 2, wl + ww // 2

    contour= []

    fig = plt.figure(figsize=(10, 5))
    ax1,ax2 = fig.add_subplot(1, 2, 1), fig.add_subplot(1, 2, 2)

    ax1.imshow(img, cmap='bone', vmin=ww_l, vmax=ww_h)

    fig.canvas.mpl_connect('button_release_event', on_button_release)
    fig.canvas.mpl_connect('motion_notify_event', on_motion)

    plt.show()

if __name__ == "__main__":
    main()
流れの説明
コードの流れとしては
- DICOM画像の表示
- マスク画像の作成(DICOM画像と同一の画像サイズで符号なしの8bit画像)
- DICOM画像で領域指定(右クリックを押したままマウス移動)
- マウスを移動させることでその座標をリストに追加していく
- マウスを離すことで領域抽出完了
- マスク画像に領域を描出
といった流れになっていきます。
上記コードで
DICOM画像の表示はmain関数内
DICOM画像で領域抽出は「on_motion」関数
マスク画像に領域を描出は「on_button_release」関数
で指定しています。
領域抽出
領域抽出は、DICOM画像上で抽出する領域をなぞっていくことでその座標を、リストに登録していきます。
ここでは、numpyの配列としてではなく、リストとして扱っていきます。
numpy配列として、2次元データに2次元データをひとつづつ追加していこうとするとちょっと厄介なことが起こるので。。。。。(詳細はいつか記事にしたいと思っています)
リストとして扱っていけば、純粋にappendで追加していけます。
追加する際に、整数型として追加していきます。
contour.append([int(event.xdata), int(event.ydata)])
また、なぞった位置をDICOM画像上に表示しておきたいので
ax1.add_patch(Circle((event.xdata, event.ydata), 0.1, color=’r’))
で画像上にプロットして
fig.canvas.draw()
で画像を再描出しています。
マスク画像に領域を描出 cv2.fillConvexPoly
なぞった座標のリストを別の画像上に描出します。
上記コードの32行目
mask = np.zeros_like(img, dtype=np.uint8)
でマスク画像用の配列をデータ0で作成しています。
配列の型は、マイナスデータなしの8bit画像です。なので階調は0~255となります。
先ほどなぞって登録したリストをmask上に描出します。
この機能は、openCVを使います。
cv2.fillConvexPoly(mask, np.array(contour), color=255, lineType=cv2.LINE_AA)
この関数は矩形を描出し、その中を塗りつぶします。
ここで先ほどの座標データを使うのですが、受けるデータはnumpy配列で整数型しか受けてくれません。
なので、リストに登録する際にint型を指定して追加していました。
そのリストをnumpy配列に変換するのは
np.array(contour)
としてあげるだけでnumpy配列として扱ってくれます。非常に便利です。
で、3番目の引数で255の値を指定してあげます。もし、RGBで指定するのであれば(0,0,0)等で指定してあげれば大丈夫です。ただ、その際にはmask配列作成時にRGBとして配列を作成することを忘れないようにしてください。
これで、先ほどなぞった座標内を255の値として登録することが出来ました。
後は、画像表示して確認です。
さいごに
いかがですか?このコードだけでは何枚もの教師画像を作成するのは大変ですが、根幹となるコードはできました。
このコードがどなたかの役に立てば幸いです。
The post 画像セグメンテーションに必要な教師データ作成ツールを組んでみた first appeared on 診療放射線技師がPythonをはじめました。.]]>はじめに
今回は、業務中によく使用する画像間演算であるサブトラクションをやってみたいと思います。
コードの流れ
サブトラクションをやるには最低2枚の画像が必要となりますので、画像の読み込み工程を2つ作成します。その際、どちらの画像からどちらの画像を引き算するのか決めなくてはなりませんが、今回はコードを簡単にするため初めに取り込んだ画像から、2枚目に取り込んだ画像をひき算することにします。
続いて、計算結果を格納する配列を作成します。この配列は、取り込んだ画像と同じサイズの配列を作成します。
画像間演算、引き算のコードを書いていきます。
最後に、画像表示のコードを書いて完成となります。
コードを書いていく
画像のピクセルデータを取り込む
まずは、画像を読み込む工程からやっていきます。込みこむ工程は、画像のパスを変数に取り込んでから、それをクラスに渡して画像のピクセルデータを配列に取り込み形になります。
それではコードを書いていきたいと思います。
DICOM画像を使いますので、pydicomのインポートをします。
画像の読み込みは、毎回使用しているfileselectのモジュールを使用します。まだ、ご覧になっていない方はこちら。fileselectのファイルは、今回書いているコードと同じフォルダの中に入れておいてくださいね。
今回もフォルダで一括選択する方法で画像を読み込みたいと思います。
# -- coding utf-8 --
import pydicom
import fileselect as fs

filenames = fs.folder_fileselect()
まずは、fileselectのモジュールを用いてフォルダ内の画像パスをfilenamesの変数に取り込みます。
そして、その変数をClassに渡し画像のピクセルデータを配列に取り込みます。
以前の記事から、Classの部分のコードをコピーします。画像読み込みをクラスを使ってやってみたの記事はこちらの記事を参照ください。
クラスがよくわからない方はこちらを参照ください。
このクラスではnumpyを用いていますのでnumpyのインポートを忘れないようにしましょう。
# -- coding utf-8 --
import pydicom
import fileselect as fs
import numpy as np

class Pixarr:
    def __init__(self,filenames):
        dcm = pydicom.dcmread(filenames[0])

        self.row = dcm[0x0028,0x0010].value
        self.column = dcm[0x0028,0x0011].value
        self.ww = dcm[0x0028,0x1050].value
        self.wl = dcm[0x0028,0x1050].value

        self.pix_arr = np.zeros((len(filenames),self.row,self.column),
            dtype ='int16')

        if len(filenames) == 1:
            self.pix_arr = dcm.pixel_array
        else:
            for i in range(len(filenames)):
                dcm = pydicom.dcmread(filenames[i])
                img_no = dcm[0x0020,0x0013].value
                self.pix_arr[img_no-1] = dcm.pixel_array

filenames = fs.folder_fileselect()
f0 = Pixarr(filenames)

filenames = fs.folder_fileselect()
f1 = Pixarr(filenames)
読み込んだ画像パスをClassに渡すのですが、ひかれる画像をf0、ひく画像をf1と名前を付けてクラスに渡します。(上記コード28行目)
これで、ひかれる画像のピクセルデータを取り込むことができました。
同様に、引く画像をf1として取り込みます。f0の時と同様にコードを書きます。(上記コード30~31行目)
これで、画像の読み込みは完了です。
画像間演算したデータを格納する配列を作成する
画像間演算のコードを書く前に、計算結果を格納する配列を作成します。
引く画像、引かれる画像と同一サイズの配列を作成します。f0,f1どちらでも構わないのですが同じ大きさの配列f2を作成します。その際に、0で初期化しておきます。
同一サイズの配列を作成するコードは
f2 = numpy.full_like(f0.pix_arr,0)
で作成できます。numpyはインポートする際npの名称でインポートしていますので、実際のコードは下記コード33行目の様にnp.full_likeの形になります。
# -- coding utf-8 --
import pydicom
import fileselect as fs
import numpy as np

class Pixarr:
    def __init__(self,filenames):
        dcm = pydicom.dcmread(filenames[0])

        self.row = dcm[0x0028,0x0010].value
        self.column = dcm[0x0028,0x0011].value
        self.ww = dcm[0x0028,0x1050].value
        self.wl = dcm[0x0028,0x1050].value

        self.pix_arr = np.zeros((len(filenames),self.row,self.column),
            dtype ='int16')

        if len(filenames) == 1:
            self.pix_arr = dcm.pixel_array
        else:
            for i in range(len(filenames)):
                dcm = pydicom.dcmread(filenames[i])
                img_no = dcm[0x0020,0x0013].value
                self.pix_arr[img_no-1] = dcm.pixel_array

filenames = fs.folder_fileselect()
f0 = Pixarr(filenames)

filenames = fs.folder_fileselect()
f1 = Pixarr(filenames)

f2 = np.full_like(f0.pix_arr,0)
画像間演算、サブトラクションのコード
サブトラクションはピクセル同士の引き算ですので本来であれば
f2[i] = f0.pix_arr[i] – f1.pix_arr[i]
のコードをfou文で繰り返すと考えるかもしれませんが、実はpythonでの配列計算はとても簡単で
f2 = f0.pix_arr – f1.pix_arr
の一文だけで済んでしまいます。もちろん、引き算だけでなく足し算でも使えますし、掛け算、割り算でも使用可能です。
for文でピクセルごとに計算しているよりも全然高速です。
ここまでのコードは以下となります。
# -- coding utf-8 --
import pydicom
import fileselect as fs
import numpy as np

class Pixarr:
    def __init__(self,filenames):
        dcm = pydicom.dcmread(filenames[0])

        self.row = dcm[0x0028,0x0010].value
        self.column = dcm[0x0028,0x0011].value
        self.ww = dcm[0x0028,0x1050].value
        self.wl = dcm[0x0028,0x1050].value

        self.pix_arr = np.zeros((len(filenames),self.row,self.column),
            dtype ='int16')

        if len(filenames) == 1:
            self.pix_arr = dcm.pixel_array
        else:
            for i in range(len(filenames)):
                dcm = pydicom.dcmread(filenames[i])
                img_no = dcm[0x0020,0x0013].value
                self.pix_arr[img_no-1] = dcm.pixel_array

filenames = fs.folder_fileselect()
f0 = Pixarr(filenames)

filenames = fs.folder_fileselect()
f1 = Pixarr(filenames)

f2 = np.full_like(f0.pix_arr,0)

f2 = f0.pix_arr - f1.pix_arr
画像表示のコード
画像表示はmatplotlibを使用したいと思いますので、まずはmatplotlibをインポートします。
# -- coding utf-8 --
import pydicom
import fileselect as fs
import numpy as np
import matplotlib.pyplot as plt

class Pixarr:
    def __init__(self,filenames):
        dcm = pydicom.dcmread(filenames[0])

        self.row = dcm[0x0028,0x0010].value
        self.column = dcm[0x0028,0x0011].value
        self.ww = dcm[0x0028,0x1050].value
        self.wl = dcm[0x0028,0x1050].value

        self.pix_arr = np.zeros((len(filenames),self.row,self.column),
            dtype ='int16')

        if len(filenames) == 1:
            self.pix_arr = dcm.pixel_array
        else:
            for i in range(len(filenames)):
                dcm = pydicom.dcmread(filenames[i])
                img_no = dcm[0x0020,0x0013].value
                self.pix_arr[img_no-1] = dcm.pixel_array

filenames = fs.folder_fileselect()
f0 = Pixarr(filenames)

filenames = fs.folder_fileselect()
f1 = Pixarr(filenames)

f2 = np.full_like(f0.pix_arr,0)

f2 = f0.pix_arr - f1.pix_arr
画像表示は引かれる画像、引く画像、計算後の画像の3画像表示したいと思います。
まずは、画像を表示設定からです。matplotlibで画像や、グラフ等を表示する際にまずはfigの設定をし、その後にaxの設定をします。ここが、よくわからないところかもしれませんが、考え方としては何もないところで絵を描こうとするときにまずは、画板や机を準備すると思います。それがfigにあたります。その後、その上に絵を描く紙を準備すると思います。それがaxにあたると考えやすいと思います。
figの設定は
fig = plt.figure()
チュートリアルはこちら
axの設定は
ax = fig.add_subplot()
で設定していきます。チュートリアルはこちら。
figの大きさの設定をします。引数の中にfigsize =(横、縦)で設定をします。
fig = plt.figure(figsize=(15, 5))
どこに画像を表示するかはaxの括弧の中に引数として指定します。
ax0 = fig.add_subplot(1,3,1) #一番左に表示
ax1 = fig.add_subplot(1,3,2) #真ん中に表示
ax2 = fig.add_subplot(1,3,3) #一番右に表示
括弧内の初めの引数は縦方向の画像数を、2個目の引数は横方向の画像数、3個目の引数を何番目に画像を表示するかという設定になります。
続いて、axにどの画像を表示するかの設定に入ります。
引かれる画像をax0に、引く画像をax1に、演算後の画像をax2として設定していきます。
ax0.imshow(f0.pix_arr[sl],cmap= 'bone')
ax1.imshow(f1.pix_arr[sl],cmap= 'bone')
ax2.imshow(f2[sl],cmap= 'bone')
これで、画像表示の設定は完了です。
# -- coding utf-8 --
import fileselect as fs
import pydicom
import numpy as np
import matplotlib.pyplot as plt

class Pixarr:
    def __init__(self,filenames):
        dcm = pydicom.dcmread(filenames[0])

        self.row = dcm[0x0028,0x0010].value
        self.column = dcm[0x0028,0x0011].value
        self.ww = dcm[0x0028,0x1050].value
        self.wl = dcm[0x0028,0x1050].value

        self.pix_arr = np.zeros((len(filenames),self.row,self.column),
            dtype ='int16')

        if len(filenames) == 1:
            self.pix_arr = dcm.pixel_array
        else:
            for i in range(len(filenames)):
                dcm = pydicom.dcmread(filenames[i])
                img_no = dcm[0x0020,0x0013].value
                self.pix_arr[img_no-1] = dcm.pixel_array

filenames = fs.folder_fileselect()
f0 = Pixarr(filenames)

filenames = fs.folder_fileselect()
f1 = Pixarr(filenames)


f2 = np.full_like(f0.pix_arr,0)

f2 = f0.pix_arr - f1.pix_arr

fig = plt.figure(figsize=(15, 5))
plt.subplots_adjust(left=0, right=1, bottom=0, top=1, wspace=0.05, hspace=0.05)
ax0 = fig.add_subplot(1,3,1)
ax1 = fig.add_subplot(1,3,2)
ax2 = fig.add_subplot(1,3,3)

ax0.imshow(f0.pix_arr[sl],cmap= 'bone')
ax1.imshow(f1.pix_arr[sl],cmap= 'bone')
ax2.imshow(f2[sl],cmap= 'bone')
axに画像の設定をした際に [sl] とありますが、これは、何枚目の画像を表示するかの変数になります。マウスホイールを回すことで画像を切り替えるための変数です。(上記コードの38行目 sl = 0 とコードを追加してください。)
その機能を実装していきます。
これは、マウスイベントと言って右クリックや、左クリック、マウスホイールを回す、または押す等のイベントで何をするか決められます。
マウスホイールのイベントは
fig.canvas.mpl_connect('scroll_event', wheel_scroll)
動作設定はdefで関数を作成して決めます。今回はwheel_scrollという名前で設定しますが、次回matplotlibのマウスイベントで詳しく説明したいと思いますので今回はコードの提示だけとします。
# -- coding utf-8 --
import fileselect as fs
import pydicom
import numpy as np
import matplotlib.pyplot as plt

class Pixarr:
    def __init__(self,filenames):
        dcm = pydicom.dcmread(filenames[0])

        self.row = dcm[0x0028,0x0010].value
        self.column = dcm[0x0028,0x0011].value
        self.ww = dcm[0x0028,0x1050].value
        self.wl = dcm[0x0028,0x1050].value

        self.pix_arr = np.zeros((len(filenames),self.row,self.column),
            dtype ='int16')

        if len(filenames) == 1:
            self.pix_arr = dcm.pixel_array
        else:
            for i in range(len(filenames)):
                dcm = pydicom.dcmread(filenames[i])
                img_no = dcm[0x0020,0x0013].value
                self.pix_arr[img_no-1] = dcm.pixel_array

def wheel_scroll(event):
    global sl

    if event.button == 'down':
        sl += 1
        if sl > len(filenames)-1:
            sl =0

    if event.button == 'up':
        sl -= 1
        if sl < 0:
            sl = len(filenames)-1

    ax0.imshow(f0.pix_arr[sl], cmap='bone')
    ax1.imshow(f1.pix_arr[sl], cmap='bone')
    ax2.imshow(f2[sl], cmap='bone')

    fig.canvas.draw()

filenames = fs.folder_fileselect()
f0 = Pixarr(filenames)

filenames = fs.folder_fileselect()
f1 = Pixarr(filenames)

f2 = np.full_like(f0.pix_arr,0)

f2 = f0.pix_arr - f1.pix_arr

sl =0

fig = plt.figure(figsize=(15, 5))
plt.subplots_adjust(left=0, right=1, bottom=0, top=1, wspace=0.05, hspace=0.05)
ax0 = fig.add_subplot(1,3,1)
ax1 = fig.add_subplot(1,3,2)
ax2 = fig.add_subplot(1,3,3)

ax0.imshow(f0.pix_arr[sl],cmap= 'bone')
ax1.imshow(f1.pix_arr[sl],cmap= 'bone')
ax2.imshow(f2[sl],cmap= 'bone')

fig.canvas.mpl_connect('scroll_event', wheel_scroll)

plt.show()
最後に
いかがでしたか?お持ちのDICOM画像でサブトラクションできましたでしょうか?

上記コードで実行した結果です。マンモのMRI Dynamic画像、一番左が単純、真ん中が動脈相、一番左がサブトラクション画像となります。
正常乳腺は引き算され、腫瘍は濃染されているのが確認できると思います。
皆さんも試してみてください。
お疲れ様でした。
The post 画像間演算、サブトラクションをやってみる。 first appeared on 診療放射線技師がPythonをはじめました。.]]>はじめに
今回は画像信号値の最大値、最小値、中央値、平均値、標準偏差を求める方法をやってみたいと思います。これら値を求める方法はpythonの標準ライブラリーのstatisticsや、pandas、scipy、numpyと様々なライブラリーで求めることができます。
しかし、pydicomで出されるピクセル配列がnumpy配列の為、numpyを用いて求めていきたいと思います。
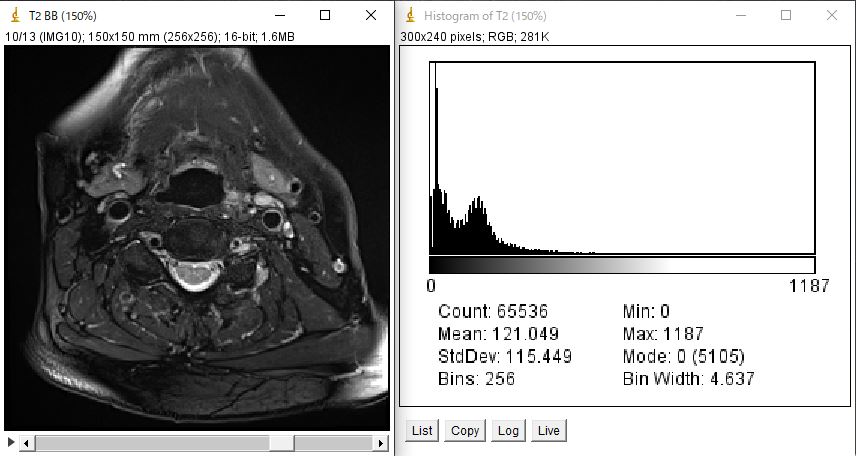
画像は前回用いた画像を用いてやっていきます。
最大値を求める
最大値を求めるコードは
np.max(配列)
を用いて求めます。(下記コード11行目)
# -- coding utf-8 --

import pydicom
import numpy as np
import fileselect as fs

filename = fs.single_fileselect()
dcm = pydicom.dcmread(filename)

max_value = np.max(dcm.pixel_array)

print(max_value)
結果は”1187”と返され、上記ヒストグラムの最大値を合っています。
最小値を求める
最小値を求めるコードは
np.min(配列)
で求めることができます。(下記コード12行目)
# -- coding utf-8 --

import pydicom
import numpy as np
import fileselect as fs

filename = fs.single_fileselect()
dcm = pydicom.dcmread(filename)

max_value = np.max(dcm.pixel_array)
min_value = np.min(dcm.pixel_array)

print(max_value)
print(min_value)
結果は最小値0が返ってきます。
中央値を求める
中央値を求めるコードは
np.median(配列)
となります。(下記コード13行目)
# -- coding utf-8 --

import pydicom
import numpy as np
import fileselect as fs

filename = fs.single_fileselect()
dcm = pydicom.dcmread(filename)

max_value = np.max(dcm.pixel_array)
min_value = np.min(dcm.pixel_array)
median_value = np.median(dcm.pixel_array)

print(max_value)
print(min_value)
print(median_value)
結果は103.0となりました。
平均値を求める
平均値を求めるコードは
np.mean(配列)
で求めることができます。(下記コード14行目)
# -- coding utf-8 --

import pydicom
import numpy as np
import fileselect as fs

filename = fs.single_fileselect()
dcm = pydicom.dcmread(filename)

max_value = np.max(dcm.pixel_array)
min_value = np.min(dcm.pixel_array)
median_value = np.median(dcm.pixel_array)
mean_value = np.mean(dcm.pixel_array)

print(max_value)
print(min_value)
print(median_value)
print(mean_value)
結果は121.04859924316406となりました。
標準偏差を求める
標準偏差を求めるコードは
np.std(配列)
で求めることができます。(下記コード15行目)
# -- coding utf-8 --

import pydicom
import numpy as np
import fileselect as fs

filename = fs.single_fileselect()
dcm = pydicom.dcmread(filename)

max_value = np.max(dcm.pixel_array)
min_value = np.min(dcm.pixel_array)
median_value = np.median(dcm.pixel_array)
mean_value = np.mean(dcm.pixel_array)
std_value = np.std(dcm.pixel_array)

print(max_value)
print(min_value)
print(median_value)
print(mean_value)
print(std_value)
結果は115.44804225706706となりました。
最後に
今回は、最大値、最小値、中央値、平均値、標準偏差を求める方法をやってみました。
今回、最頻値を求める方法を取り上げませんでしたがnumpyでは最頻値を簡単に求める方法がありませんので、一度ヒストグラムを求め、度数配列から最大値を求め、その階級がどの値なのかを求める方法となると思われます。
ただ、その方法は面倒なので他のライブラリを用いて求めてしまった方が簡単に求められると思います。
それでは、お疲れ様でした。
環境
- windows10
- python3.6.1
- Anaconda custom(64-bit)
- PyCharm2020.2(Communication Edition)
はじめに
今回は、画像のヒストグラムを求めてみたいと思います。
ヒストグラムを使用する場面としては、グラフで視覚的に信号値の分布を見たい時と、信号値の分布を数値として知りたい時があると思います。
そこで、今回はグラフとして求める方法と、数値として得る方法2つを紹介したいと思います。
求める手段としては以下の2つをやっていきます。
- matplotlibでグラフ表示
- numpyで求める
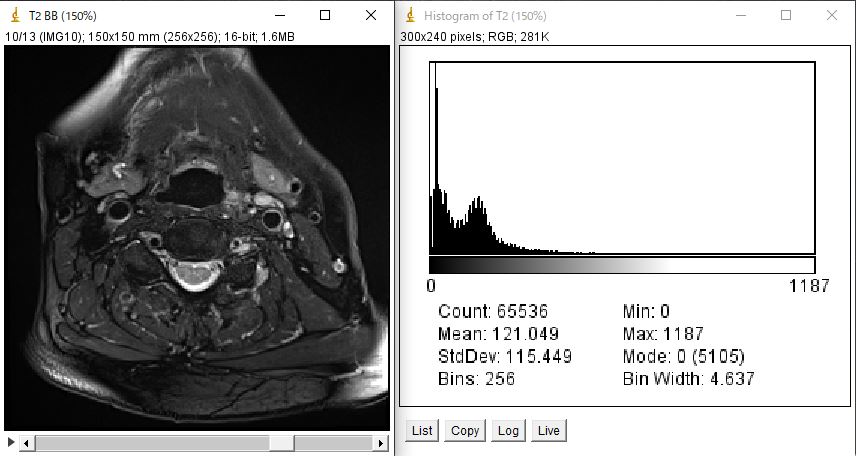
それでは、下の左側の画像を用いてそれぞれ紹介していきたいと思います。
ちなみに、右側は左側の画像のヒストグラムをimage-Jで表示したものです。
matplotlibでグラフ表示
まずはmatplotlibを用いて表示する方法を紹介します。
使用するライブラリーはmatplotlibのpyplotとなります。
それでは、コードを表示したいと思います。
# -- coding utf-8 --

import pydicom
import matplotlib.pyplot as plt
import numpy as np
import fileselect as fs

filename = fs.single_fileselect()
dcm = pydicom.dcmread(filename)

plt.hist(dcm.pixel_array)
plt.show()
ライブラリーのfileselectのコードはこちらを参照ください
上記コードで、ヒストグラムを求めるコードは12行目のplt.hist()となります。
カッコ内に第1引数としてピクセルデータの配列を指定します。
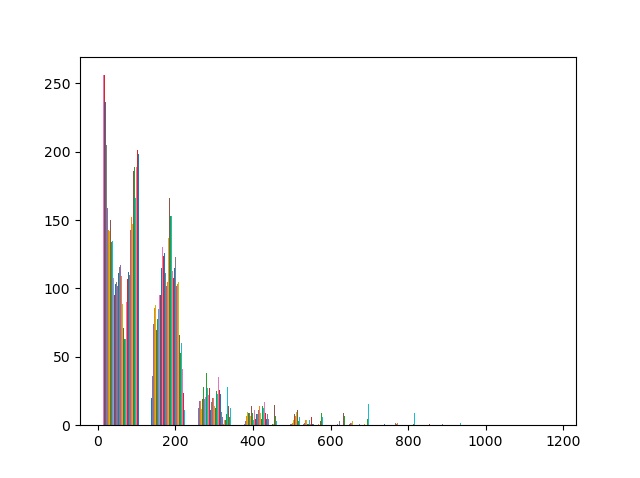
何か変だと思いませんか?ところどころ途切れているように見えます。階級であるbinの設定をしてみたいと思います。image-Jのヒストグラムと同一の設定にしてみましょう。image-Jではbinが256で設定されていますので上記コード12行目を以下に変更します。
# -- coding utf-8 --

import pydicom
import matplotlib.pyplot as plt
import numpy as np
import fileselect as fs

filename = fs.single_fileselect()
dcm = pydicom.dcmread(filename)

plt.hist(dcm.pixel_array,bins = 256)
plt.show()
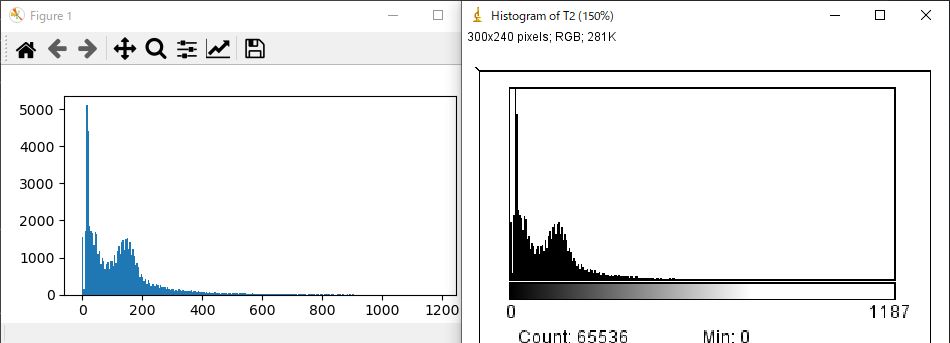
いかがでしょうか?同様の結果となりましたね。
その他、グラフの色を変えたり、グラフのタイプを変えてみたりと様々な設定はカッコ内に記載していきます。詳しくは以下のチュートリアルを参照してください。
matplotlib ヒストグラムのチュートリアルはこちら
追伸
ヒストグラムを求める際、多次元配列の場合に行を1つのデータと認識してしまい思い通りのヒストグラムが得られない場合があります。その場合は、1次元配列に変換して求めると思い通りのヒストグラムを求めることができる場合があります。
numpyで求める
早速、コードから入ってみたいと思います。
# -- coding utf-8 --

import pydicom
import numpy as np
import fileselect as fs

filename = fs.single_fileselect()
dcm = pydicom.dcmread(filename)

hist_np = np.histogram(dcm.pixel_array.ravel())

print(hist_np)
上記コードでヒストグラムを求めるコードは11行目のmp.histogram()となります。matplotlibの時と同様にカッコ内に引数にピクセルデータの配列を指定します。
しかし、注意していただきたいところがあります。
numpyでヒストグラムを求める場合、配列は1次元配列でなければならないということです。なので、11行目で多次元配列を1次元配列にするravel()を用いてdcm.pixel_arrayを1次元配列に変更しています。
それでは、コードを実行してみましょう。結果は以下となりました。
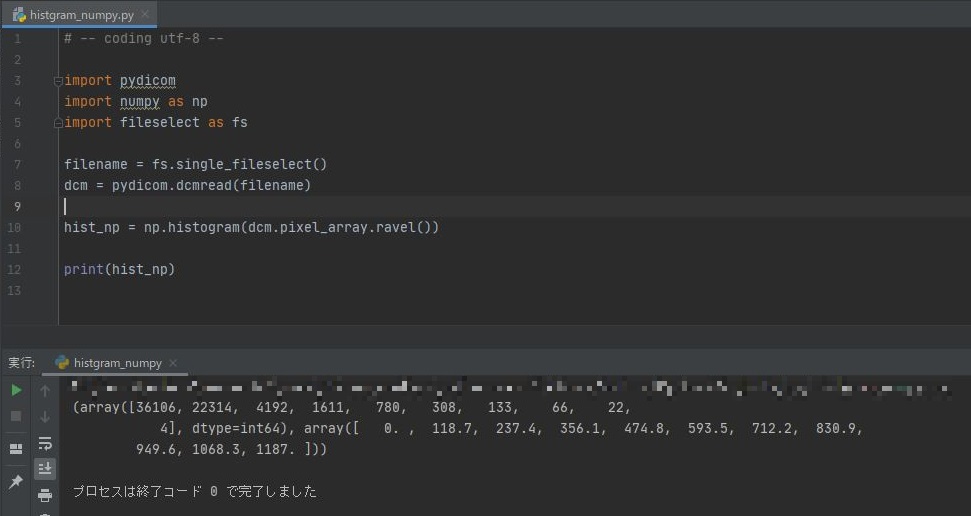
結果は
[36106,22314,4192,1611,780,300,133,66,22,4]
[0,110.7,237.4,356.1,474.8,593.5,712.2,830.9,949.6,1060.3,1187]
という2つの配列が返ってくる結果となりました。1つ目の配列の要素数は10個、2つ目の配列の要素は11個となっています。
それぞれの配列は何を示しているのでしょうか?それは、1つ目は度数を示しており、2つ目の配列は階級の幅であるbinの幅を示しています。
なので、2つ目の配列は0~118.7、118.8~237.4と言うようにその範囲を示しています。よって10個の範囲があることが分かります。
これを、先ほどと同じように階級binの設定をして再度表示させてみましょう。
# -- coding utf-8 --

import pydicom
import numpy as np
import fileselect as fs

filename = fs.single_fileselect()
dcm = pydicom.dcmread(filename)

hist_np = np.histogram(dcm.pixel_array.ravel(),bins=256)

print(hist_np)
matoplotlibの時と同様にヒストグラムを求めるコード(11行目)の引数にbins=256と足してあげます。結果はどうだったでしょうか?
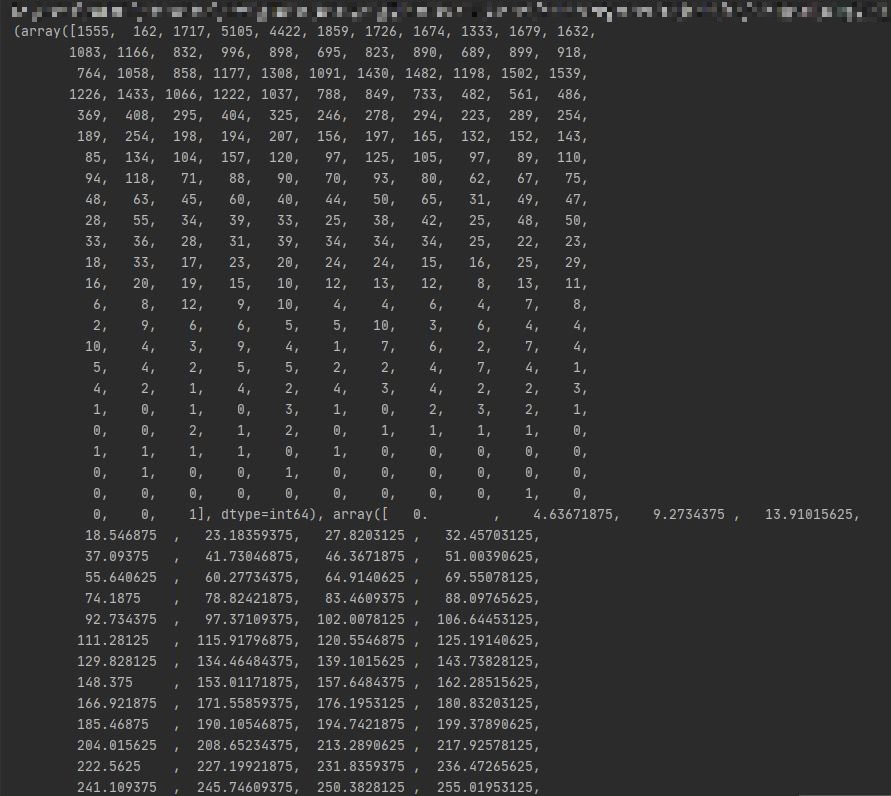
先ほどよりも、要素数が増えているのが分かります。はじめにimage-Jで求めたヒストグラムをリストとして出力したものが下の図のようになります。

いかがでしょうか?階級の幅、度数共に同様の結果となっています。
numpyにおいても様々な引数が用意されています。こちらのチュートリアルを参照してください。
最後に
いかがでしたか?今回はヒストグラムを求めるをやってみました。ヒストグラムは、画像にフィルタをかけたり、再構成をしたりした時に元画像との比較にする際に非常に役に立ちますね。是非ともマスターしておきたい技術ですね。
お疲れ様でした。
環境
- windows10
- python3.6.1
- Anaconda custom(64-bit)
- PyCharm2020.2(Communication Edition)