Notice: Function _load_textdomain_just_in_time was called incorrectly. Translation loading for the urvanov-syntax-highlighter domain was triggered too early. This is usually an indicator for some code in the plugin or theme running too early. Translations should be loaded at the init action or later. Please see Debugging in WordPress for more information. (This message was added in version 6.7.0.) in /virtual/mcu03iphuk/public_html/radiology-technologist.info/wp-includes/functions.php on line 6114

Notice: Function _load_textdomain_just_in_time was called incorrectly. Translation loading for the breadcrumb-navxt domain was triggered too early. This is usually an indicator for some code in the plugin or theme running too early. Translations should be loaded at the init action or later. Please see Debugging in WordPress for more information. (This message was added in version 6.7.0.) in /virtual/mcu03iphuk/public_html/radiology-technologist.info/wp-includes/functions.php on line 6114

Notice: Function _load_textdomain_just_in_time was called incorrectly. Translation loading for the advanced-ads domain was triggered too early. This is usually an indicator for some code in the plugin or theme running too early. Translations should be loaded at the init action or later. Please see Debugging in WordPress for more information. (This message was added in version 6.7.0.) in /virtual/mcu03iphuk/public_html/radiology-technologist.info/wp-includes/functions.php on line 6114

Notice: 関数 _load_textdomain_just_in_time が誤って呼び出されました。lancr ドメインの翻訳の読み込みが早すぎました。これは通常、プラグインまたはテーマの一部のコードが早すぎるタイミングで実行されていることを示しています。翻訳は init アクション以降で読み込む必要があります。 詳しくは WordPress のデバッグをご覧ください。 (このメッセージはバージョン 6.7.0 で追加されました) in /virtual/mcu03iphuk/public_html/radiology-technologist.info/wp-includes/functions.php on line 6114
tkinterでmatplotlibの画像を表示 | 診療放射線技師がPythonをはじめました。

tkinterでmatplotlibの画像を表示

はじめに

こんにちは、でめきんです。

今回は、tkinterを使ってmatplotlibの画像や、グラフを表示する方法を紹介したいと思います。

これを使うことでボタンや、エントリーボックスを設定することが出来、いわゆるソフト的な物を作成することが出来て非常に便利です。

それでは、やっていきましょう。


広告
デル株式会社

流れ

matplotlibで画像を表示する際には

① fig = plt.figure()

② ax = fig.add_subplot()

③ ax = ‘画像や配列’

④ plt.show()

で画像表示をしていくわけですが、tkinterを用いて画像表示する際には

④が変わってきます。


広告
HP Directplus -HP公式オンラインストア-

使うコード

使用するコードは

FigureCanvasTkAgg(fig, master=root)

となります。

Canvas = FigureCanvasTkAgg(fig, master=root)

引数部分は(matplotlibで設定したfig , tkinterで作成した領域)となります。


広告
BTOパソコン・パソコン関連商品がお買い得!パソコン工房のセール

実際のコード

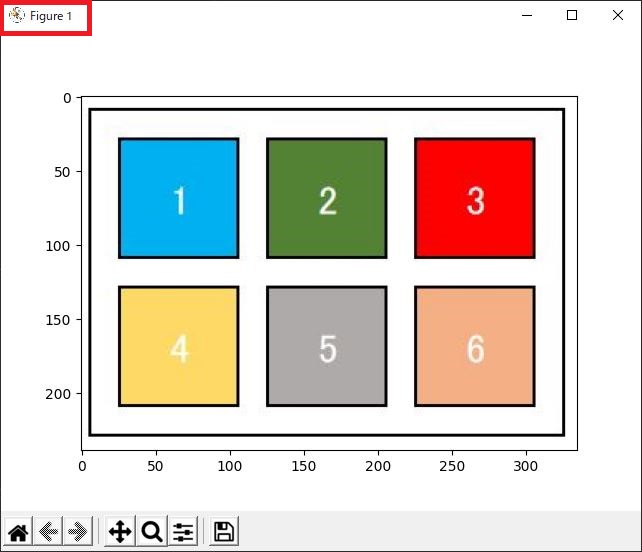
まずは、matplotlibで画像表示

左上の部分を確認するとmatplotlibのマークが出ています。


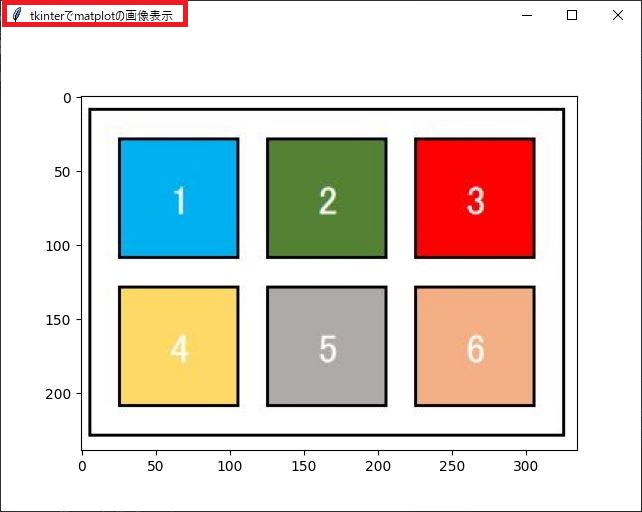
続いて本題、tkinterを使ってmatplotlibの画像を表示してみたいと思います。

まず、必要なライブラリーのインポートします。

from matplotlib.backends.backend_tkagg import FigureCanvasTkAgg

がライブラリーのインポートとなります。


左上の羽のマークがtkinterという証拠になります。


最後に

いかがでしたか?

tkinterを用いることで、GUIの作成ができるようになります。

ボタン等いろんなものを設置して、アプリを作成することが出来るようになるとプログラミングがもっと楽しくなってきますよね。

是非とも試してください。

広告
上新電機 パソコン買取サービス

Categories:

, ,